
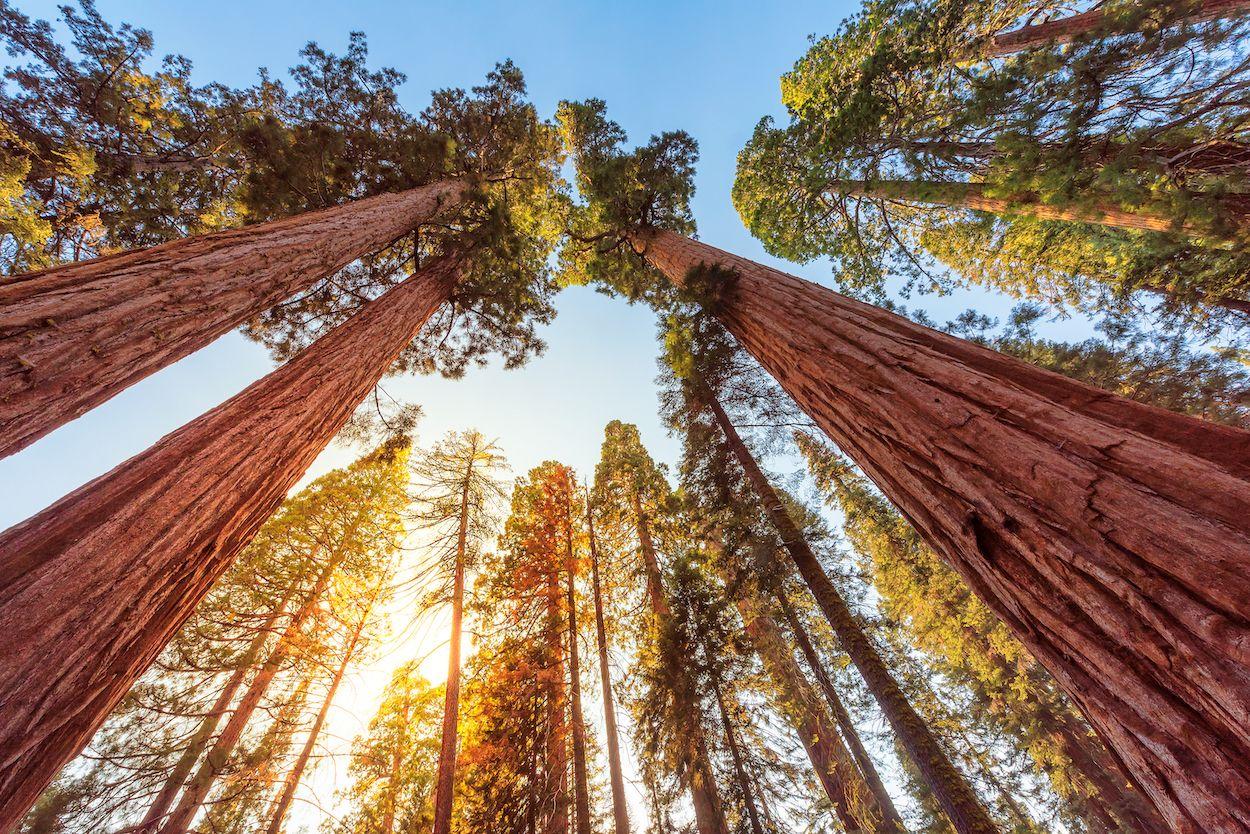
Giant sequoia trees define much of the landscape in Sequoia National Park, California (photo by Dmitry Vinogradov/iStock).
If you’ve ever wondered how tall a towering tree is, you’re in good company.
Foresters, land managers, and researchers have been working for decades to better understand the structure of our forest landscapes—but canopy height has remained challenging to measure, both from the ground and from space.
Now, advances in remote sensing tools and technology are making it easier to map the height of trees across diverse landscapes, unlocking new insights into our forest ecosystems.
When it comes to trees, height matters
Canopy height is a uniquely valuable metric for forest scientists, with significant implications for a range of ecosystem services.
“The height of a forest canopy can tell you so much about the trajectory of development of a forest, from how productive it is to what disturbances it’s been through,” said Chris Woodall, CTrees’ director of U.S. forest science and policy. “It’s one of the most critical remotely sensed metrics you can have in your back pocket.”
By including canopy height data in allometric equations (mathematical models that estimate biomass based on measurable tree characteristics), scientists can significantly improve the accuracy of their aboveground biomass estimates.
In turn, they can more reliably track changes in aboveground biomass across forest landscapes over time—helping countries improve carbon accounting and assess progress towards ambitious climate goals.
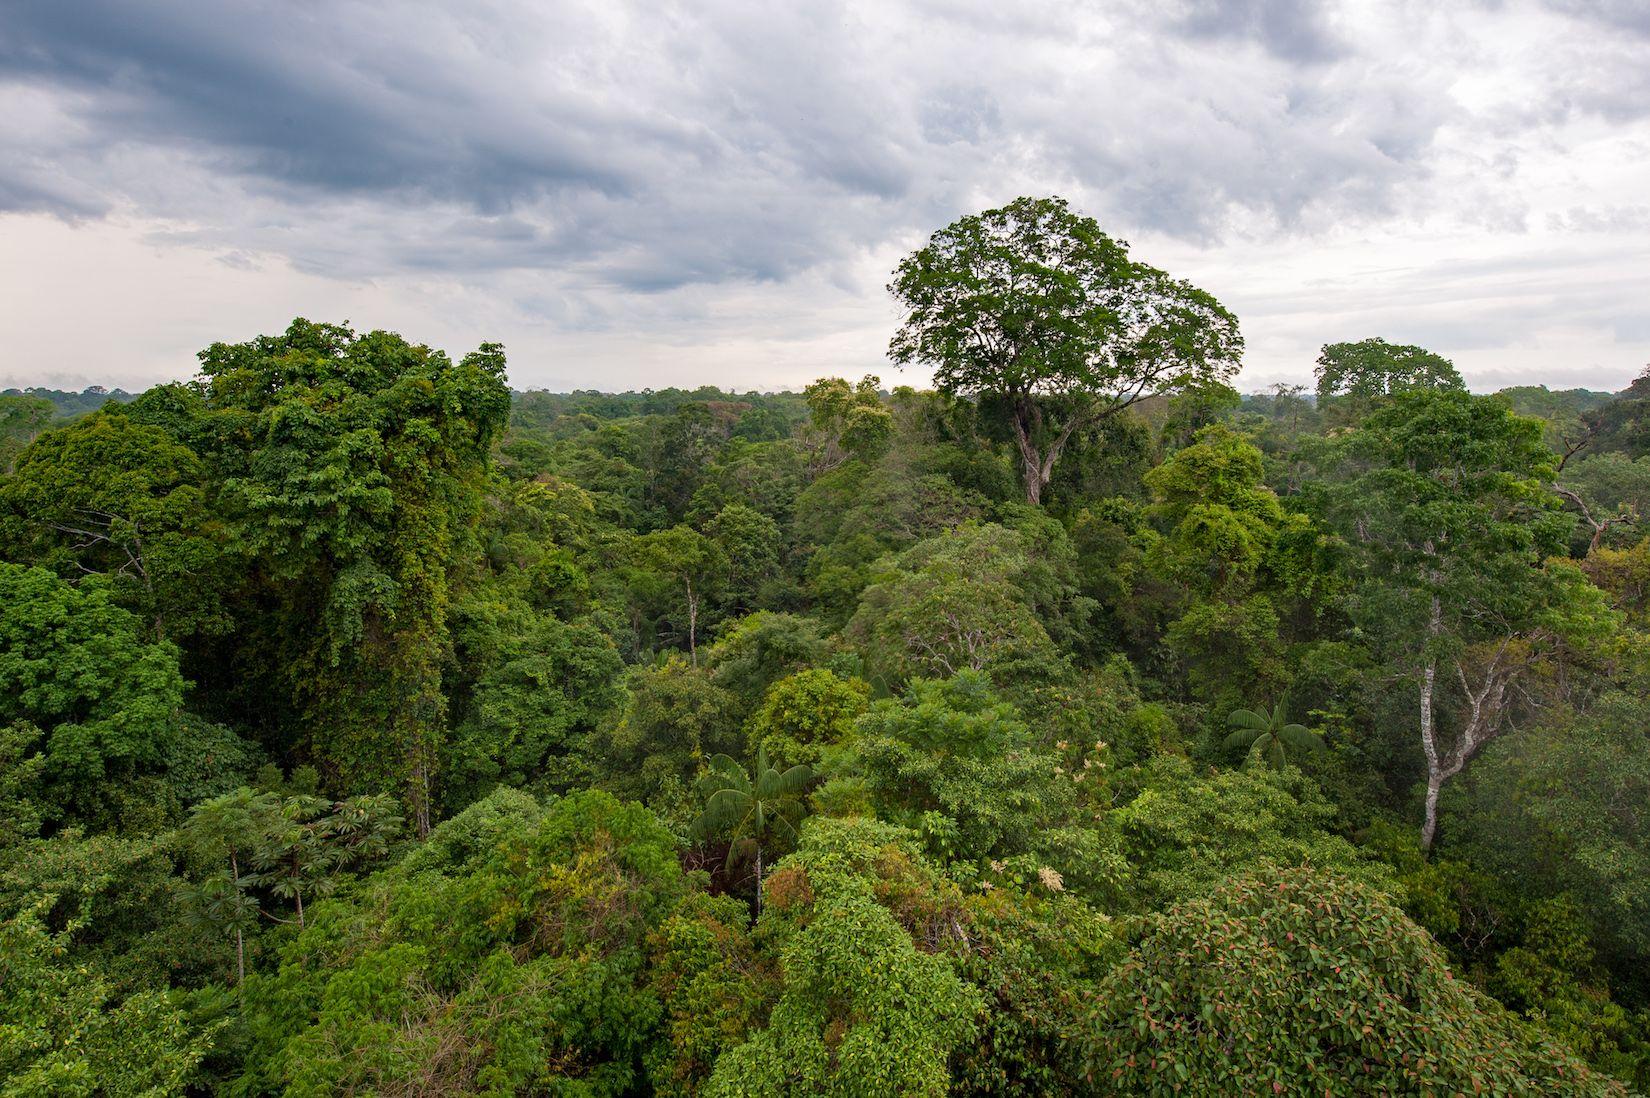
Researchers estimate that up to 45% of carbon stored on land may be tied up in our forests (source: https://www.science.org/content/article/earth-home-3-trillion-trees-half-many-when-human-civilization-arose).
Measuring canopy height also produces valuable estimates of canopy cover. Together, these two metrics enable the identification of individual tree crowns and provide greater insight into forest structure and productivity.
The increased visibility into our forests can guide more sustainable forest management, boost biodiversity, and help curb deforestation—even in a warming world.
Measuring canopy height in urban landscapes
In urban environments, canopy height is an important indicator of ecosystem benefits including shade, air quality, and microclimate regulation.
"Trees are widely recognized as an effective strategy for mitigating extreme heat, but the magnitude of their cooling benefits depends on their extent, canopy structure, and height," said CTrees research scientist Mayumi Hirye, who recently mapped canopy cover and height across the 100 largest urban areas in the U.S.
“By incorporating key characteristics like canopy height into models, we can better predict the degree to which evapotranspiration and the shade from a tree will cool down surrounding areas.”
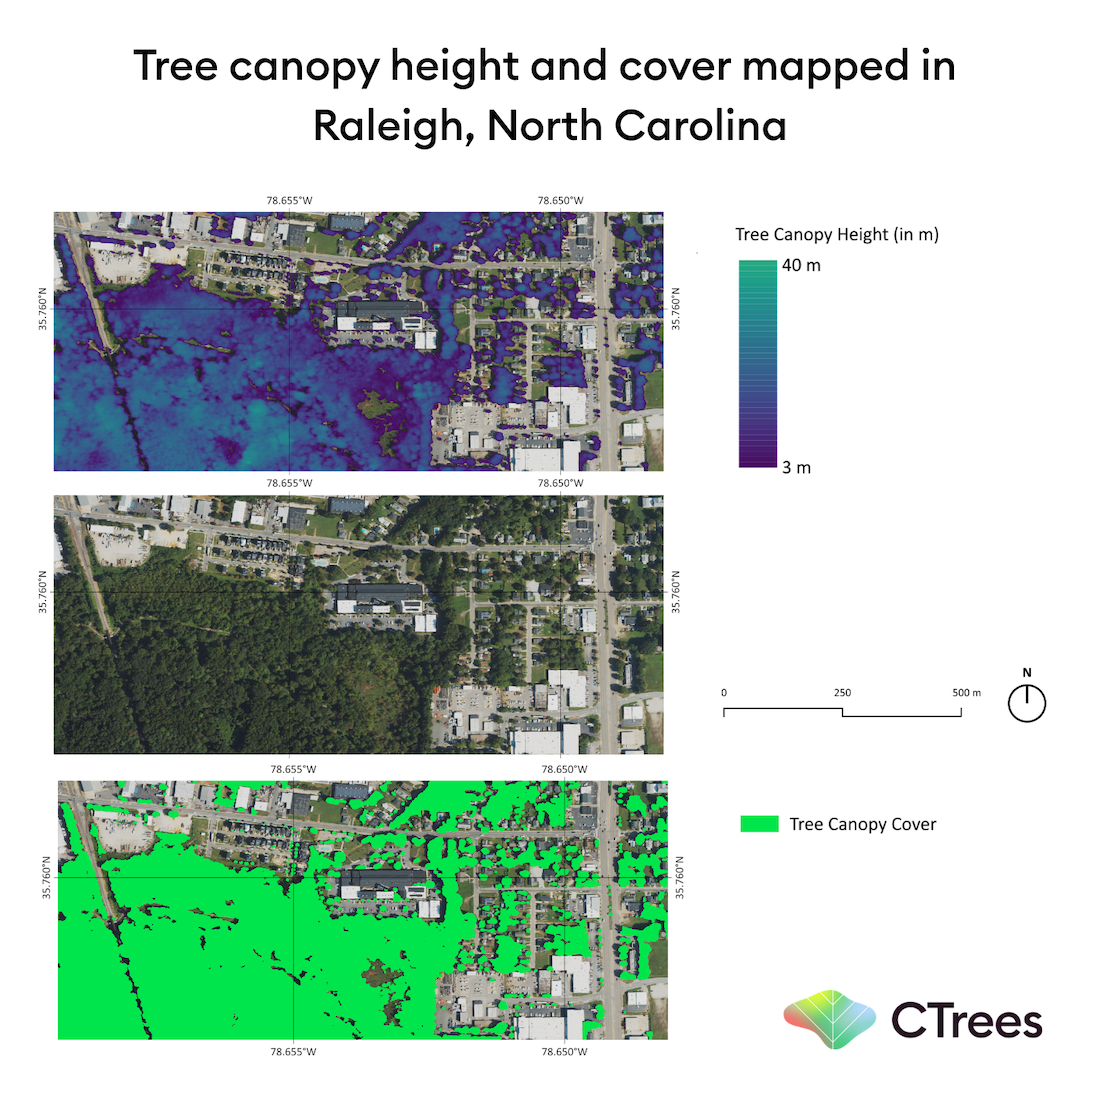
Mapping canopy height can help cities better understand urban tree canopies, a vital tool for analyzing flood risk and mitigating extreme heat.
Past challenges to mapping canopy height
Before remote sensing approaches were developed, tree height was a notoriously resource-intensive metric to measure.
Foresters had to go into the field with specialized height-measuring devices to record tree-level data. Or, technicians crudely estimated tree height by manually interpreting expensive aerial imagery.
The process was time-consuming and labor-intensive, producing only sparse samples of data from designated field plots. Scientists then scaled these field measurements across forest landscapes to create canopy height estimates.
Researchers’ tree height estimates were also limited by the lack of available data on trees located in dense, steep, or generally inaccessible terrain.
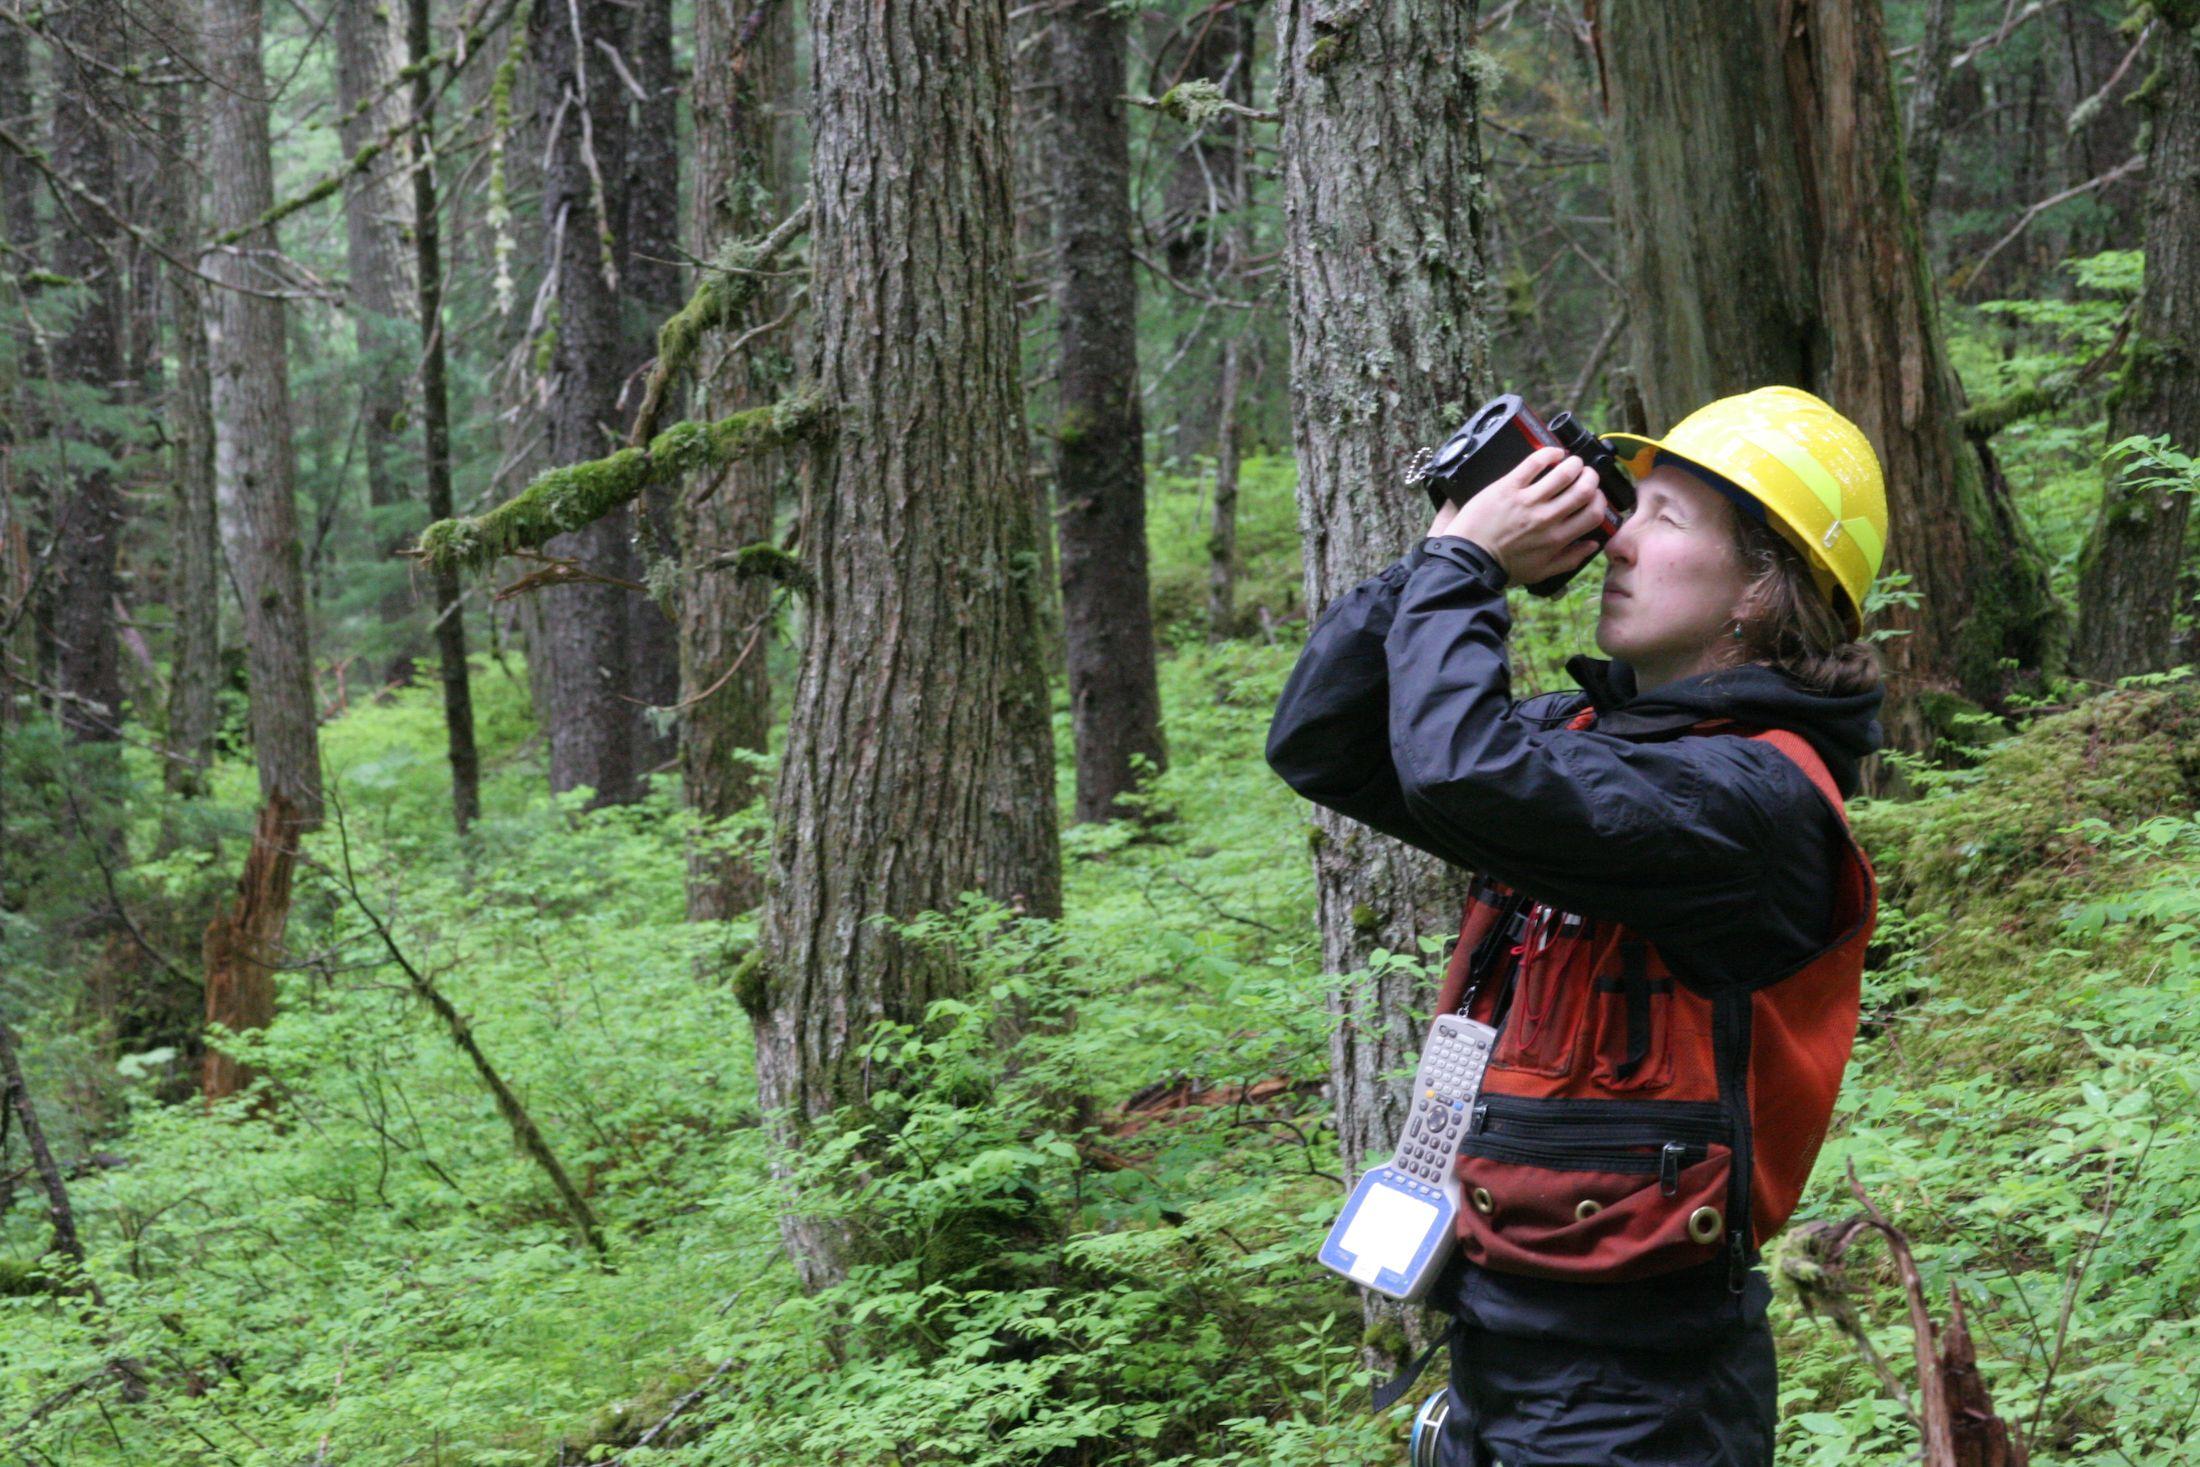
Collecting tree measurements in the forests of Coastal Alaska (photo sourced from the US Forest Service).
Today, traditional methods for measuring canopy height are unable to produce data at the speed and scale needed by forest managers to adequately address climate impacts and ensure the long-term resilience of global forests.
Fortunately, the science and technology needed to accurately measure tree height has improved significantly in recent years.
“Now, we can build scalable models that successfully map canopy height for an entire city, country, or continent,” said Hirye. “These models have relatively low errors and are machine-reproducible, meaning that they eliminate a lot of the variability associated with human measurements and make large-scale assessments more reliable and efficient.”
Building cutting-edge technologies for canopy height assessments
Computer vision and remote sensing have advanced dramatically in recent years.
Tools like LiDAR and synthetic aperture radar (SAR) can now penetrate dense cloud cover and thick forest canopies, producing unprecedented data on our forest ecosystems.
When combined with high-resolution satellite imagery and the latest deep learning and cloud computing capabilities, these technologies enable fast and comprehensive assessments of forests.
“It’s only been very recently that we’re starting to have widespread coverage of our forests that is cost-effective and can be computed so rapidly,” said Woodall. “This is opening up a whole new world of opportunity to monitor and help our forests adapt to stressors like climate change in ways that we’ve never been able to before.”
At CTrees, scientists are using these innovative tools to produce detailed and operational tree-level data.
By combining cutting-edge deep learning models with LiDAR data and satellite imagery, CTrees scientists have mapped the height of every tree in California. The model successfully estimated canopy heights up to 50 meters, and found that trees taller than 5 meters covered just over 19% of California’s landscape in 2020.
CTrees scientists also developed the most detailed canopy height assessment of the Amazon forest to date—finding an average canopy height of 22 meters.
In the coming months, CTrees will publish an annual time series of tree canopy height across the contiguous United States from 2020-2024 at 4.77-meter spatial resolution.
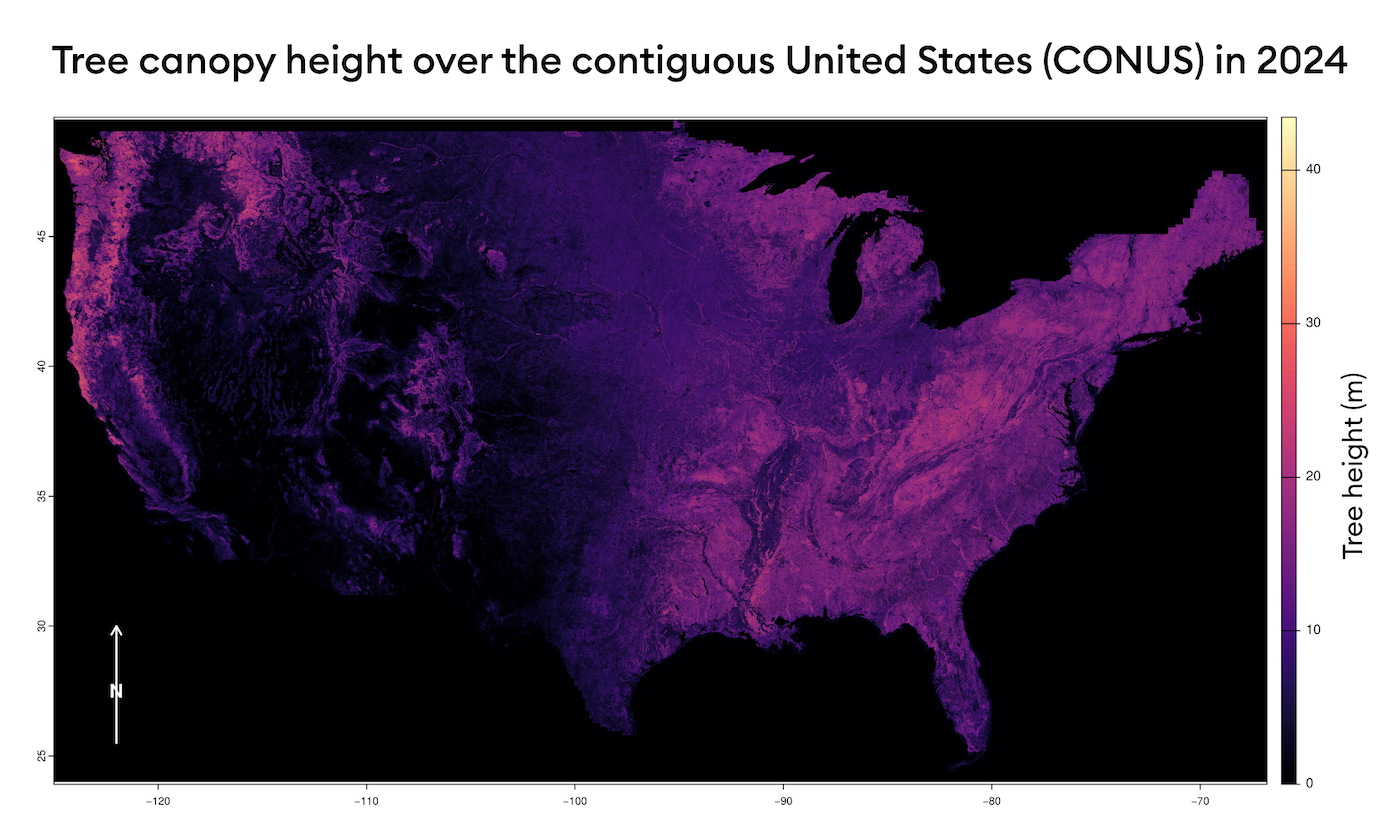
In 2024, mean canopy height across CONUS was 10.42 meters but was not evenly distributed across regions.
CTrees’ approach demonstrates a cost-effective way to transform millions of images and data points into cohesive canopy height maps and actionable insights.
The data has diverse applications for forest policy and finance—from modeling shade and mitigating extreme heat, to informing forest inventories and conducting post-wildfire assessments.
Accurate and timely canopy height data equips foresters, land managers, and decision-makers with the information needed to effectively steward our forest landscapes.
“We can expect our forests to go through accelerating change in the future,” notes Woodall. “That means our data tools and monitoring devices need to keep up for us to effectively respond, anticipate what might happen in the future, and help forests adapt.”
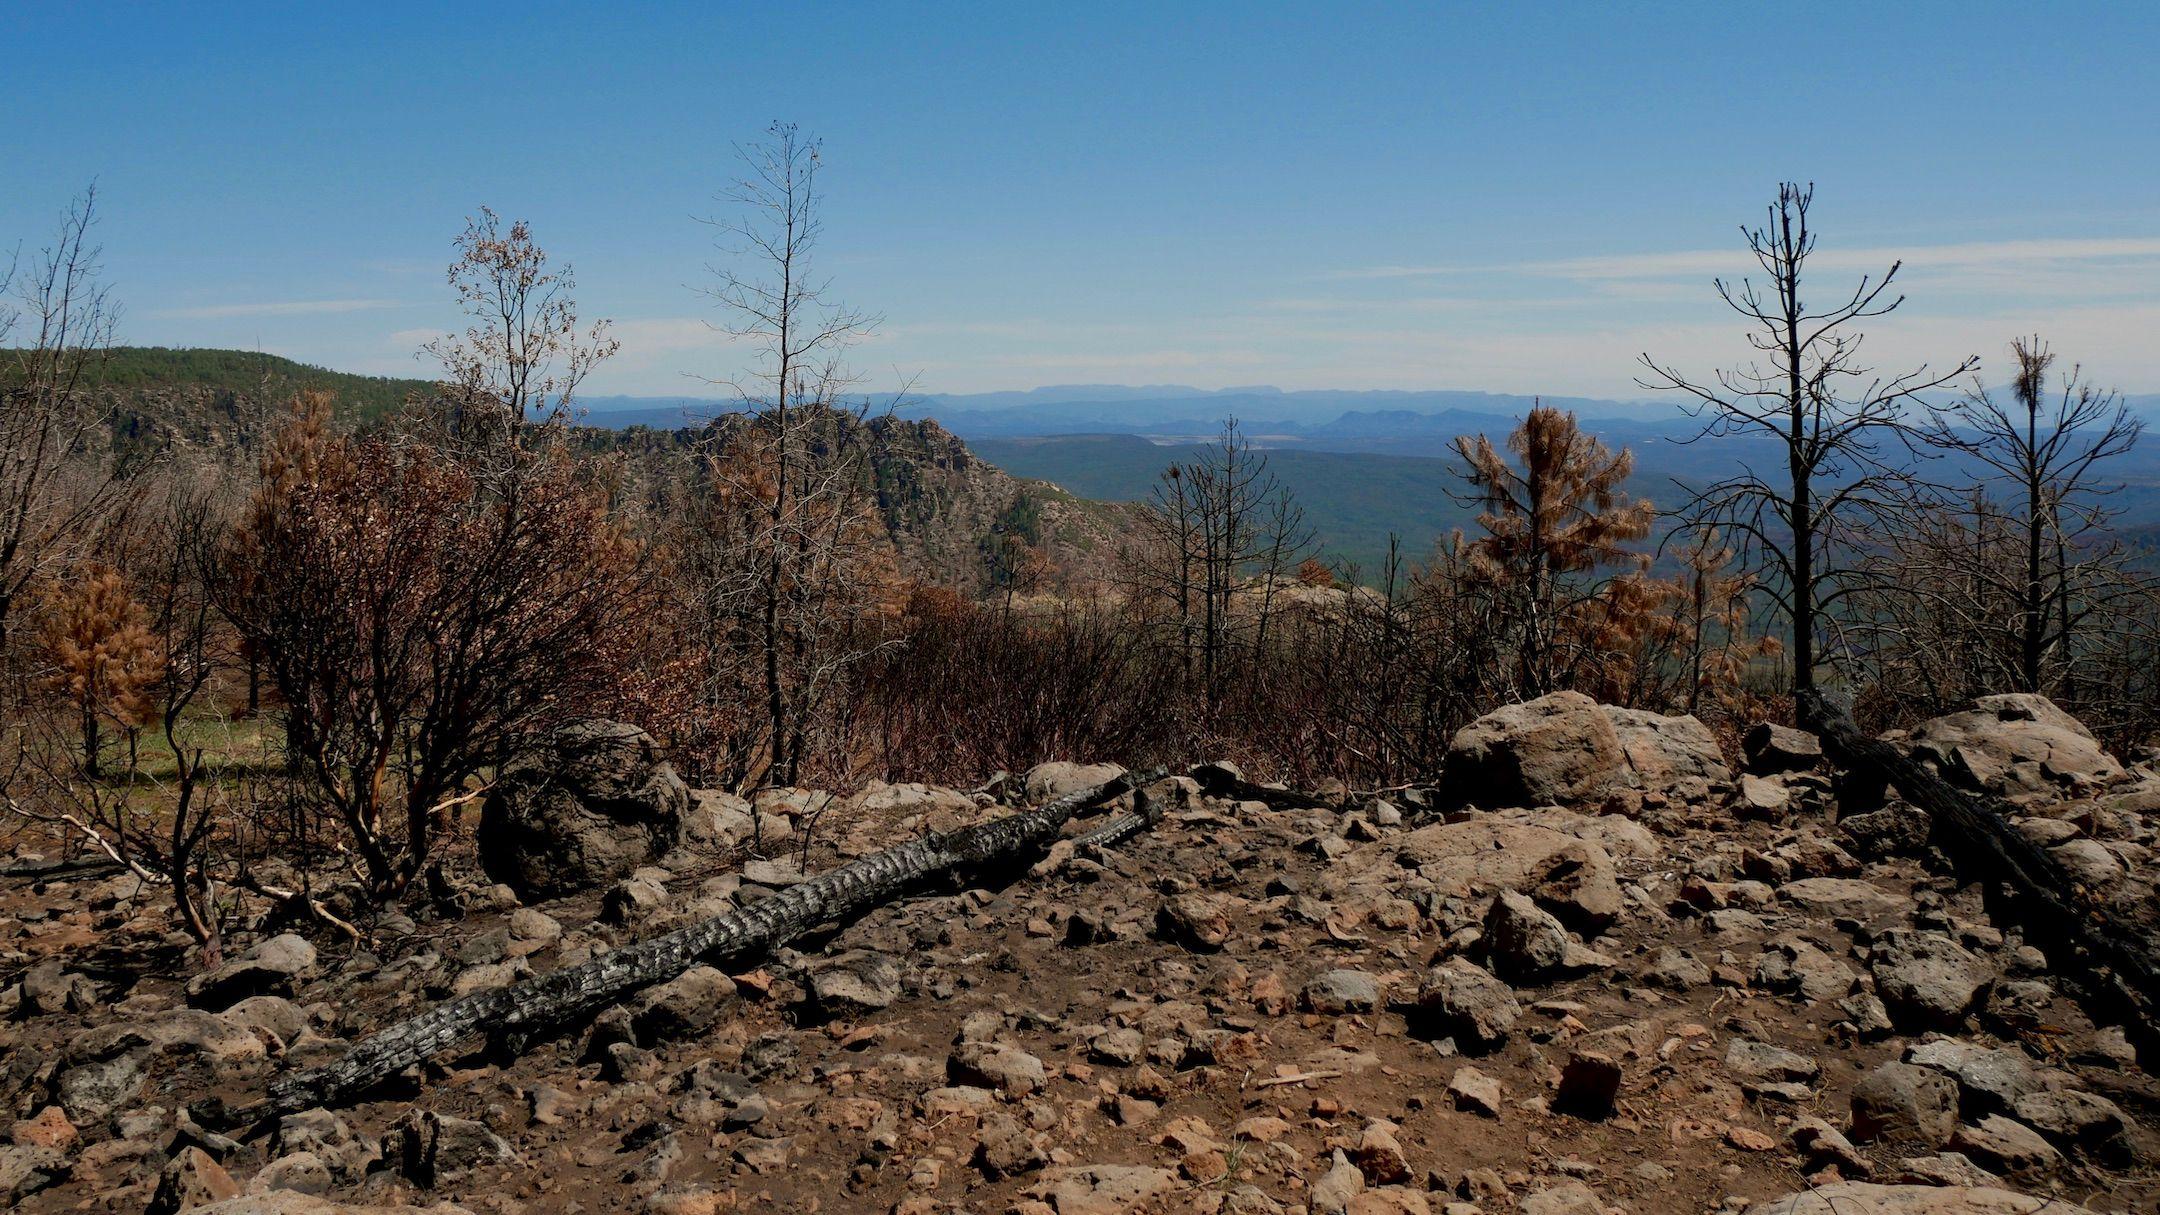
An overlook at the edge of the Mogollon Rim in Arizona, where lightning sparked a forest fire in September 2024 (photo by Rachel Kovinsky).


