
Editor’s note: This is the first of two blog posts exploring data for jurisdictional REDD+. A second post will share key technical challenges for producing JREDD+ data. See a webinar (opens in a new tab) from CTrees experts for more information on our due diligence approach.
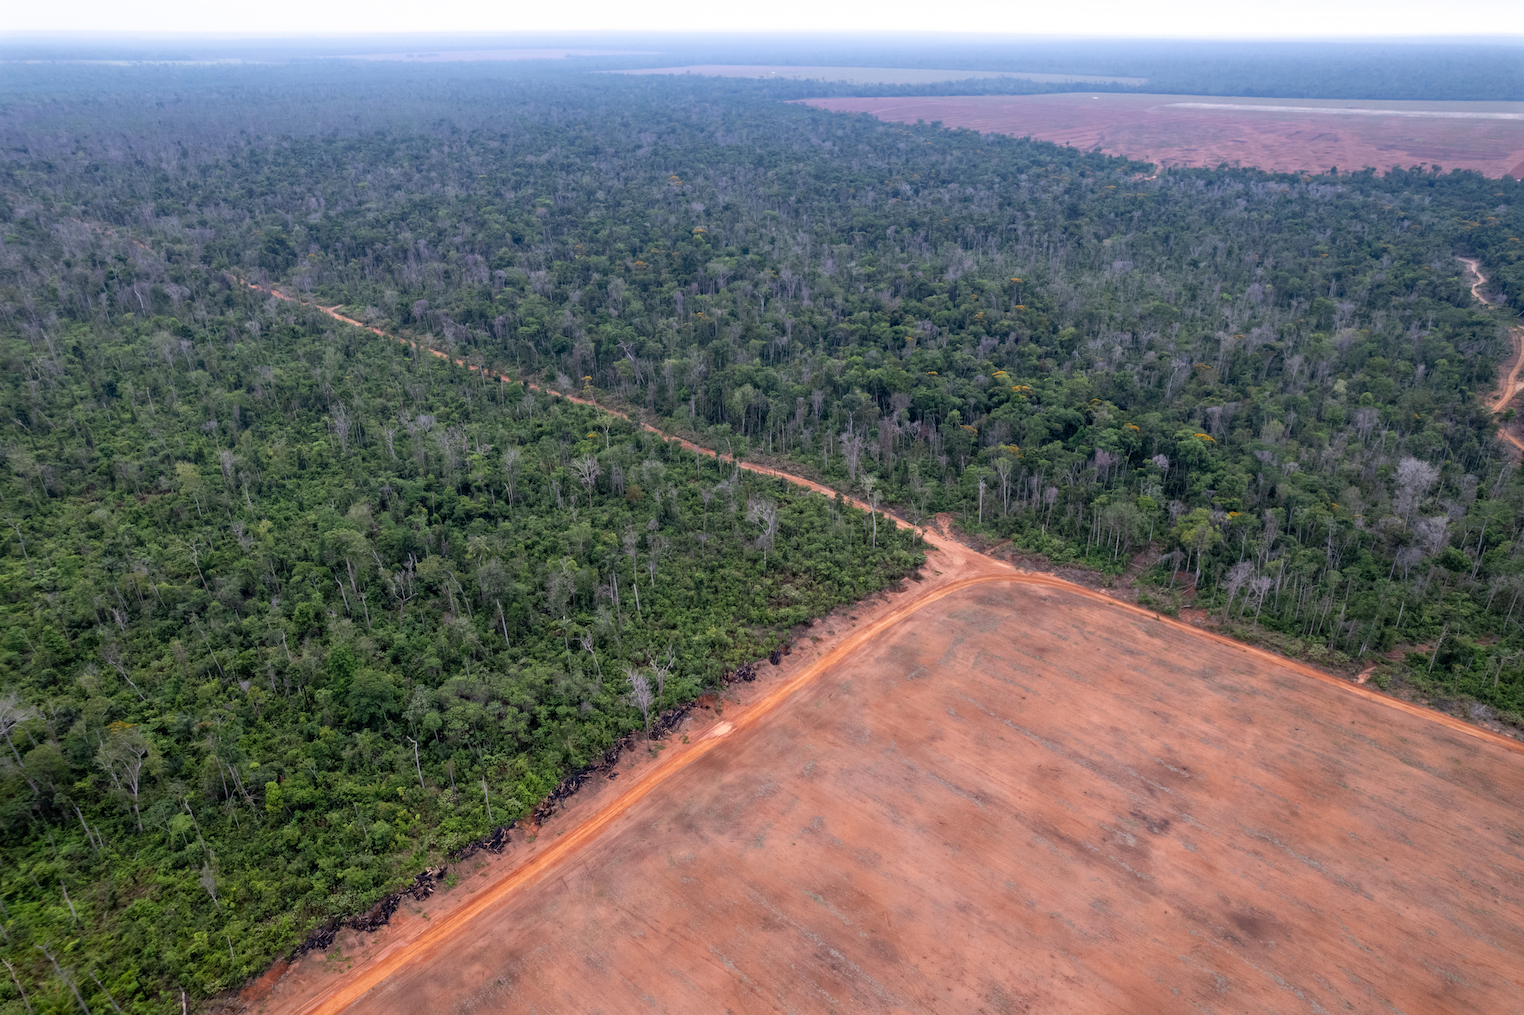
After years of development, the market for jurisdictional REDD+ credits is starting to take off.
Last month, the Architecture for REDD+ Transactions (ART) issued more than 1 million credits (opens in a new tab) to the government of Costa Rica for its forest restoration efforts. Also in June, Verra certified a jurisdictional carbon program in Argentina’s Misiones province (opens in a new tab), its first under a standard that allows for ‘nested’ issuance of jurisdictional and project-based credits. Globally, more than 40 jurisdictional programs are now under development.
The major JREDD+ credit releases, coupled with large-scale demand from corporate buyers, including airlines (opens in a new tab) under a compliance scheme called CORSIA, could lift finance for forests following several years of stalled private investment. The hope, for policymakers and investors alike, is to build a new, stable stream of funding to address deforestation and forest degradation in countries where forest loss is a leading source of greenhouse gas emissions.
Key to scaling the market is trust by all stakeholders that emissions reductions and removals are real. For JREDD+, that trust is built through a multi-step process to quantify and verify emissions reductions.
While JREDD+ issuances ultimately amount to a single number, like 1 million tons of emissions reductions, the science behind any REDD+ claim is complicated, involving calculations of forest cover, deforestation, emission factors, and regrowth over time.
How JREDD programs report and verify results
For JREDD+ credits to be approved for issuance and ready for investment, three steps of analysis and data review are required:
Jurisdictions submit a report on emissions reductions to a standard body like ART, FCPF, or Verra, with carbon accounting based on the standard’s guidelines.
Accredited, independent validation and verification bodies (VVBs) apply a series of protocols to review data and safeguards at intervals defined by the standard, submitting reports and opinions to the standard body.
Independent analysts provide due diligence assessments to evaluate the carbon credits and assure investors that the jurisdictions’ reported emissions reductions are supported by available evidence.
Transparent and comparable data is needed–but largely unavailable
In a best case scenario, transparent and comparable data would be available at each step of the application, issuance, and verification process, to allow any party to analyze a jurisdictions’ emissions reductions efforts.
In reality, CTrees has found that each step results in different data and conclusions, with discrepancies that take a long time and several meetings and exchanges to understand and quantify.
Jurisdictions’ submissions vary significantly, and can be difficult to assess. Each jurisdiction may take a different approach to generating its forest data, with varying formats, definitions, methods, and time periods for baselines and monitoring. While flexibility is allowed under standards and methodologies, the variation can cause a wide variety of issues for independent analysis (a second blog post in this series will explore these challenges further).
To complicate matters, most jurisdictions’ geospatial data is inaccessible for verification.
A recent review by scientist Daniel Braga found that among the 43 jurisdictional programs listed by the ART Registry and World Bank Forest Carbon Partnership Facility (FCPF), 26 published baseline and/or monitoring reports and 21 used maps to support their characterization of deforestation. However, only six jurisdictions provided downloadable spatial datasets. Another four offered map visualization platforms without download access.
The variation in jurisdictions’ submissions, the lack of transparency, and the difficulty of producing independent reviews, makes a simple, high-impact investment in JREDD+ credits suddenly look more complex. For investors still smarting from scientific and media critiques of REDD+ projects’ emissions reduction claims, the risk may be too high.
A more rigorous review of jurisdictions’ data is needed.
CTrees’ solution: Creating comparable datasets for JREDD+ due diligence
The way forward for those seeking independent review is to reproduce jurisdictions’ maps using best available methods. CTrees has found that by replicating the jurisdiction’s own definitions and approaches, an independent analysis with comparable results is possible.
CTrees scientists have pioneered techniques for mapping forest cover (opens in a new tab) and deforestation and forest degradation in the tropics (opens in a new tab), by applying advances in satellite monitoring and machine learning. CTrees has honed these methods for carbon markets: Since 2023, CTrees has mapped historical deforestation and forest cover in 42 jurisdictions for Verra’s REDD+ methodology, VM0048 (opens in a new tab). And since last year, CTrees has conducted an independent review of nine jurisdictions’ submissions to the ART/TREES standard and FCPF.
CTrees’ formula for independent review of JREDD is to develop maps that attribute forest activity, calculate emissions, and match definitions for ‘jurisdiction-aligned’ data. The result is accurate and comparable maps that allow our scientists to explain any discrepancies between our data and the jurisdictions’ results. CTrees goes further to assess risk on a confidence spectrum and monitor jurisdictions’ progress. Following is more detail on these steps:
1. Attributing forest activity every year to deforestation, degradation, and regrowth
Achieving emissions estimates requires first mapping activity in forests, including large-scale deforestation, fires, shifting cultivation, and logging. For the last three years, our scientists have been developing a unique dataset for the tropics, CTrees Integrated Deforestation, Degradation, and Regrowth (CIDDR). The dataset combines CTrees’ own data with data from scientific partners to detect and attribute change to the three main activities. The dataset covers the wet tropics, with some dry forest and savannah environments in Brazil and Africa.
To validate the CIDDR results, CTrees scientists use a sample-based approach. Across the 44 jurisdictions covered in this validation procedure, CTrees has used 97,000 samples to assess forest or non-forest cover, and deforestation, degradation, and regrowth. CTrees achieved consistent accuracy across diverse forest types in the tropics: 94% forest accuracy, 79% deforestation accuracy, and 12% area uncertainty for deforestation.
2. Calculating emissions with spatially explicit data
With an activity map in hand, CTrees can then apply emissions factors to estimate emissions reductions or removals across the jurisdiction.
CTrees develops its own annual and spatially explicit emission factors based on its aboveground biomass time series, a 100-meter resolution map for 2000-2025. (Note: CTrees made its AGB maps available (opens in a new tab) as an open resource earlier this year).
CTrees’ emissions factors account for differences in biome, year, and transition types (e.g., forest to non-forest, agriculture, or pasture) to ensure the carbon accounting is as accurate as possible.
3. Building jurisdiction-aligned data to compare results
CTrees’ final step is to adjust its maps, definitions, and estimates to align with the jurisdictions’ submissions to FCPF or ART.
CTrees matches its forest cover maps to the jurisdictions’ definition of a forest and adjusts its activity data to the jurisdiction’s minimum mapping unit and definition of deforestation (e.g., some jurisdictions may consider a transition from primary forest to plantation as deforestation, others might classify the change as degradation). CTrees also reviews and compares its emission factors to those reported by the jurisdiction in its submissions.
Producing jurisdiction-aligned data is a challenging but essential step for independent monitoring. It ultimately gives our scientists the ability to explain any inconsistency in activity data, and methodological differences.
4. Assessing risk on a confidence spectrum
In its due diligence reports, CTrees assess confidence in a jurisdictions' emissions claims on a spectrum, by asking four key questions:
Do emissions reduction trends align? We confirm that our own estimates point to the same downward trend the jurisdiction reports. Alignment indicates the reductions are real and are delivering genuine climate benefits.
Are the differences explainable? Where differences appear, we ask whether they are explainable by data or methodological choices not captured in our jurisdiction alignment procedures.
Are emission reduction estimates within a 95% confidence interval? We assess the magnitude of the reduction and compare it statistically to our estimates, testing whether the confidence intervals are meaningfully different.
Does the evidence support robust, uncertain, or potentially overstated reduction claims? We determine whether the evidence supports the reduction being claimed, or suggests it may be overstated, therefore confirming that mechanisms like reduced deforestation and variable emission factors genuinely supports the reported reductions.
During the review process, CTrees is open to discuss findings with jurisdictions’ own experts, with the aim of helping improve their reporting and systems.
5. Monitoring progress in near-real-time
While JREDD+ methodologies require infrequent monitoring, technology is also now available to track progress in near-real-time. For JREDD+ analysis, CTrees expands on its public LUCA alert platform (opens in a new tab), tailoring the alert data to each jurisdiction's forest activity definitions, and providing attribution to deforestation and degradation. The enhanced alert platform signals emerging threats, and includes quarterly reports reversal risks.
Building a data framework for JREDD+
In its review of nine JREDD+ programs, CTrees sees reason to be optimistic. Many jurisdictions are making real progress in reducing deforestation and degradation, and the advanced technologies that allow for annual mapping and biweekly monitoring are becoming more available.
As the JREDD+ market matures, investors and other stakeholders will require independent analysis to build trust that emissions reductions are real, verified, and not at risk of reversal. With comparable, independent data, backed by scientific approaches and advanced technology, the market can grow with confidence, scaling an important new source of finance for the communities that sustain healthy forests.
To learn more about how CTrees can support JREDD+ reporting and verification, we invite you to get in touch (opens in a new tab) via our contact form, or by emailing info@ctrees.org. Our team would be glad to explore how our data and expertise can work for you.


