
Last month, CTrees made its high-resolution canopy height data for the U.S. available in Lens (opens in a new tab), Upstream Tech’s platform that allows for remote monitoring of landscape change with access to multiple datasets.
For scientists, there is satisfaction in seeing a dataset put to work. The most telling signal that our canopy height model offers meaningful insight came not from a press release or download counter, but from a feature request.
A leading forest conservation organization began pulling our canopy height layers across so many project areas that the Lens team built a new batch-purchase function to keep up with the demand. When a platform has to expand its tooling because your data is being used at scale, that tells you something a citation never will: the data is operational.
That distinction matters to me. We didn't build 60-centimeter canopy height models for the U.S. to sit in an archive. We built them to be infrastructure—the kind of consistent, high-fidelity layer that any practicing forester, land trust, or restoration team can pull up alongside imagery and start making decisions with. Lens makes that last step easy.
Why canopy height matters
Canopy height is a uniquely useful measurement for forest managers. It anchors estimates of structure, biomass, and change, and it does so at a resolution fine enough to see individual stands rather than coarse averages.
CTrees' contribution is a single, methodologically consistent canopy height layer at 60-centimeter resolution across the entire United States, wall-to-wall rather than stitched from regional products, so a forester in Maine and one in Oregon are working from the same yardstick.
In Lens, CTrees’ canopy height metrics sit next to high-resolution imagery and indices like NDVI, so users can move from "what does this forest look like" to "how is it structured" without leaving the platform. In forests that have not been recently disturbed, estimates of canopy height can help inform decisions to reduce wildfire hazards or introduce resilience into complex natural systems.
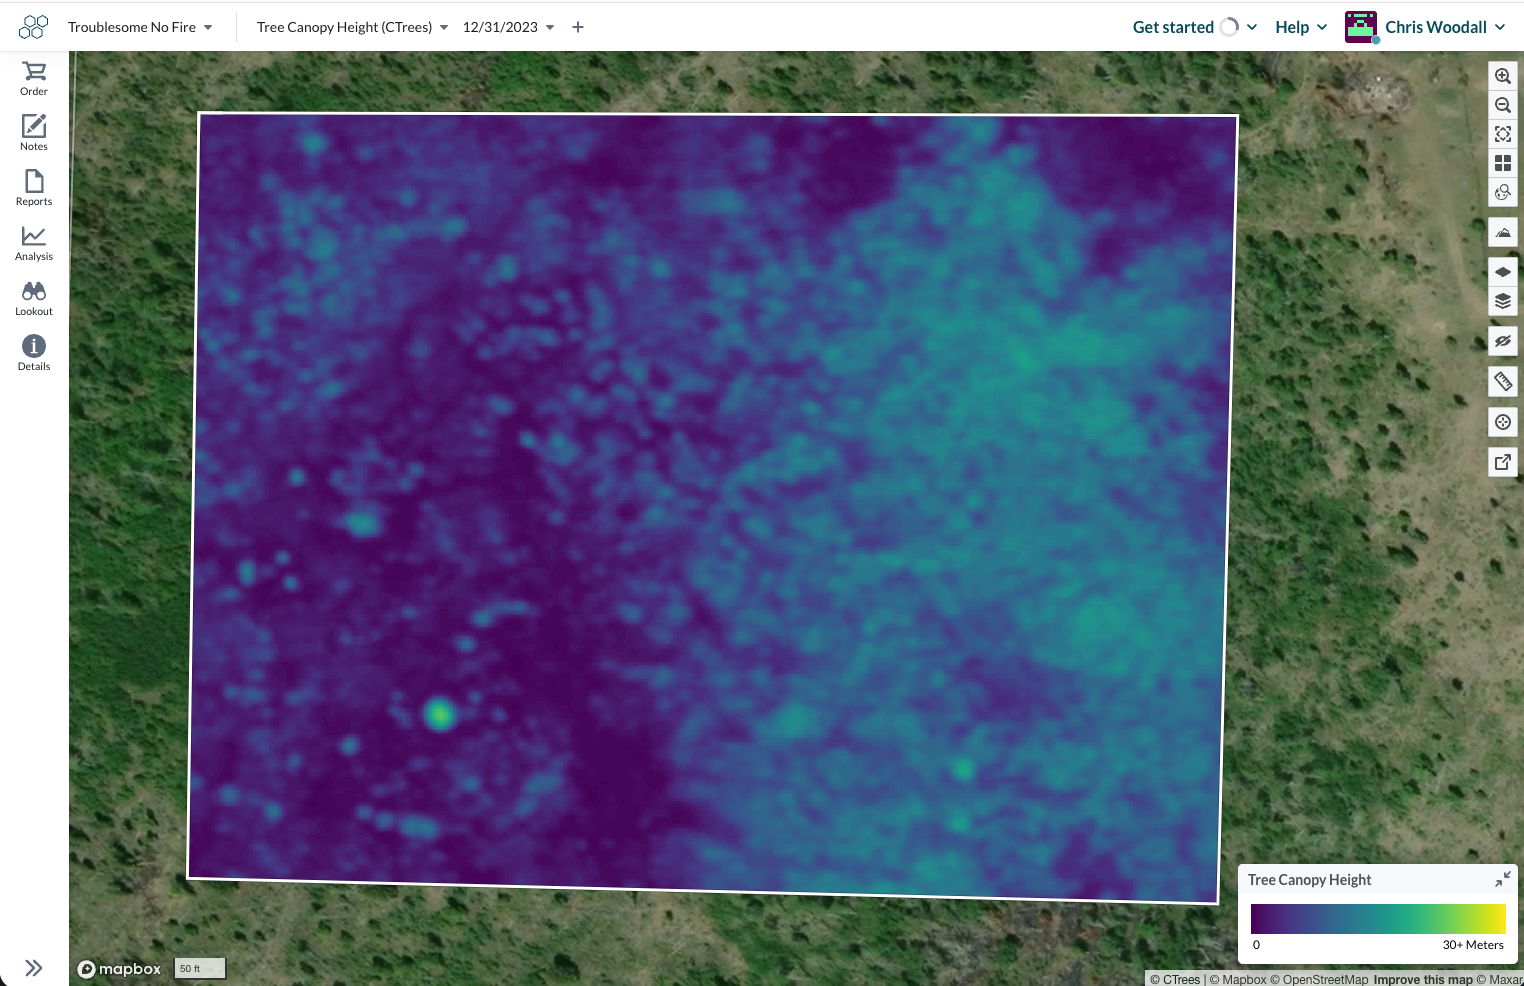
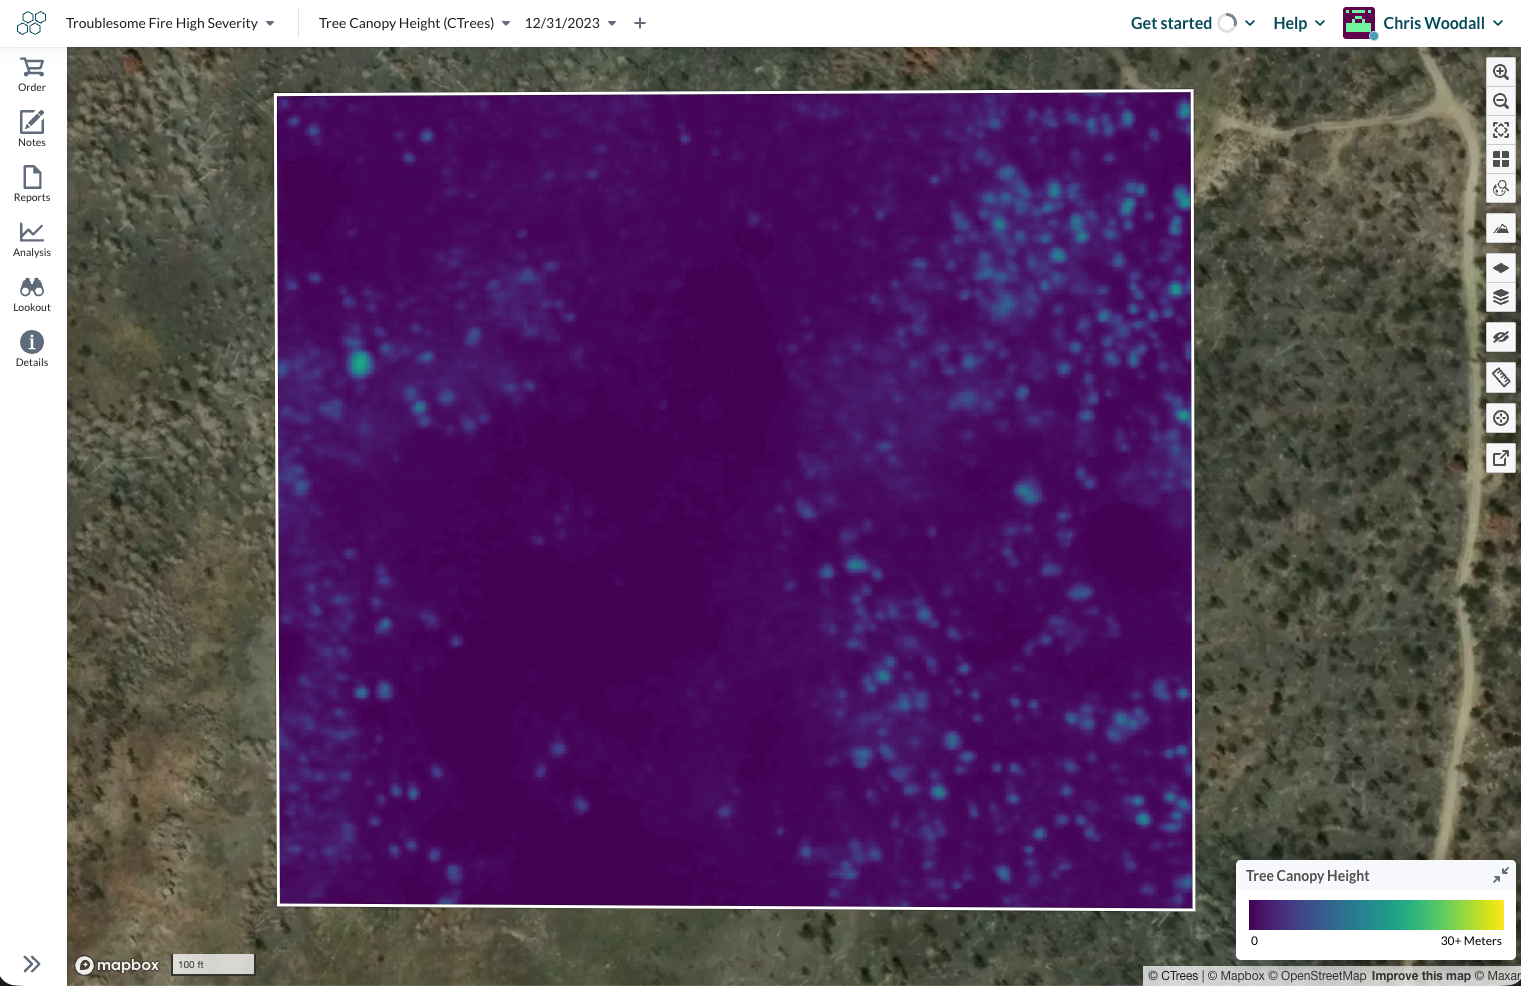
In contrast, for forests that have undergone high-impact disturbances, such as a recent wildfire, canopy height metrics can indicate the survival of residual trees and the need for rehabilitation treatments such as tree planting.
Likewise, years after such planting efforts, canopy height maps can help evaluate progress.
From data to decisions
For most of my career, the gap between good forest data and good forest decisions was a pipeline problem. The science existed, but getting it into the hands of people on the ground took specialized tools and time most organizations don't have.
Seeing CTrees’ canopy height data downloaded, at volume, for live conservation and management projects, especially in areas of the western U.S. impacted by high-severity wildfires, is the gap closing in real time.
We're early, and there's a great deal more ahead when pushing the frontier of computer vision models to segment and identify individual trees. But this felt worth marking: When a partner has to build new functionality because demand for your data outran their tools, you're no longer publishing science. You're running infrastructure.
Explore canopy height data in Lens
Access to the canopy height data requires a Lens account. Explore plans (opens in a new tab) or book a demo (opens in a new tab) with the Lens team to learn more. Interested in pursuing additional research on canopy height and forest structure? Reach out to CTrees.


