Editor’s note: This is the second of two blog posts exploring monitoring, reporting, and verification (MRV) for jurisdictional REDD+. The first post (opens in a new tab) introduced CTrees’ JREDD+ due diligence solution. See a recent webinar (opens in a new tab) for more information.
CTrees recently introduced its approach for evaluating jurisdictional REDD+ programs (opens in a new tab), country- and state-wide initiatives to reduce emissions from deforestation and forest degradation. Built around policy reform, JREDD+ offers investors a way to support systemic change in reducing deforestation.
Success for JREDD+ requires trust that emissions reductions are verified and real. Before making decisions, investors typically seek independent due diligence. But evaluating jurisdictional data is no easy feat. It requires studying jurisdictions’ definitions and calibrating forest cover and carbon datasets to produce comparable, independent results.
CTrees has developed its methods for JREDD+ analysis through scientific techniques, innovative technology, and hard-earned experience evaluating forest trends for carbon markets and policy. Since 2023, CTrees has mapped deforestation and forest cover in 42 jurisdictions for Verra’s REDD+ methodology (opens in a new tab). And since last year, CTrees has reviewed nine jurisdictions’ submissions to two JREDD standards, the Architecture for REDD+ Transactions’ TREES standard and World Bank’s Forest Carbon Partnership Facility (FCPF).
In this work, CTrees has identified eight key technical challenges that shape how we evaluate jurisdictions’ data and produce reliable results for comparison and analysis.
1. Diverse ecosystems require extra attention to establish accurate forest baselines
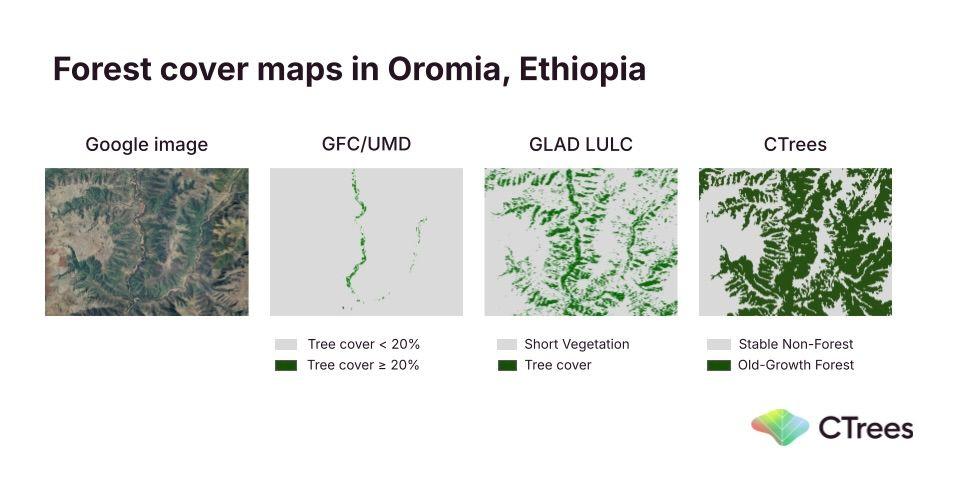
Most JREDD+ programs are located in humid tropical forests, where techniques for building forest cover maps are well established. But in dry forests, where trees are shorter, deciduous, and more dispersed in the landscape, it can be harder to achieve accurate forest cover and deforestation maps.
In the Ethiopian state of Oromia, for example, datasets like GLAD Global Forest Change, GLAD Land Cover and Land Use Change, and CTrees’ forest activity data produce significantly different results for forest cover. Without additional calibration tailored to the distinct ecosystem, independent reviews may result in inaccurate baselines and estimates of forest change.
2. Plantation activity can be misclassified as deforestation
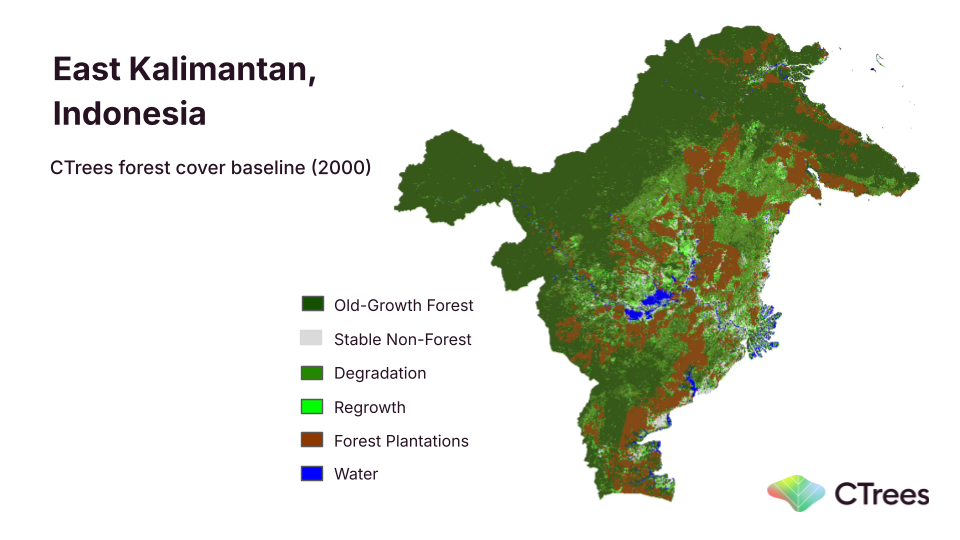
In tropical forest jurisdictions with large areas of forest plantation, remote sensing approaches may mis-classify plantation harvesting or management activities as deforestation. In East Kalimantan, Indonesia, for example, 49% of forest change detected between 2001 and 2025 was located in areas that were already commercial plantations in 2000.
To establish accurate baselines and activity maps, scientists must account for plantations, and distinguish plantation activities like harvests from conversion of intact primary (or secondary) forests to other land uses.
3. Attributing deforestation and degradation is a major challenge
Scientists have been working with satellite-based datasets to detect change in forests since the 1980s. However, attributing change to specific drivers, such as logging or fire, remains a major challenge.
In estimating the impact of record-breaking fires in Pará, Brazil, in 2024, open datasets like the Joint Research Center’s Tropical Moist Forests and GLAD Global Forest Change show moderate pixel-level agreement for unattributed forest change (~45% on average). However, attribution to deforestation or forest degradation is highly varied. The differences matter for jurisdictional emissions estimates, as deforestation is expected to result in higher emissions than degradation.
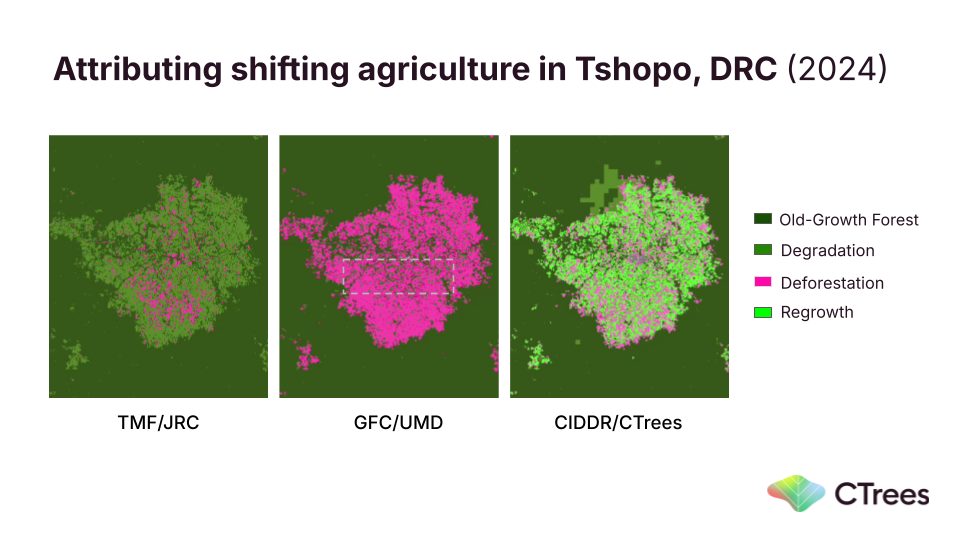
Similarly, shifting agriculture practices in the tropics create difficulties for attribution and emission estimates, as farmers create small clearings for active production, before a return to forest regrowth or a new land use, such as agroforestry, all within a short timespan.
To build a clearer picture, accurate attribution is needed. Our scientists addressed this difficulty by developing CTrees' Integrated Deforestation, Degradation, and Regrowth (CIDDR) dataset, which provides attribution to the three main activities across the tropics. Sample-based validation of 44 jurisdictions covered by the CIDDR dataset demonstrated 94% forest accuracy and 79% deforestation accuracy, with 12% area uncertainty for deforestation.
4. Different minimum mapping units (MMUs) can influence estimates of change
Jurisdictions that employ satellite imagery for digital monitoring of their territories need to define some specifications to their systems that are technically feasible and transparent. One example, the minimum mapping unit (MMU), corresponds to the smallest size area that official maps use to classify land.
PRODES data, Brazil’s official source on deforestation, uses a 6.25-hectare MMU, a relatively large size that is a legacy of old, “paper-and-pen”-based mapping techniques dating to the 1990s. With new digital technologies, scientists can develop maps with smaller MMUs following forest definitions which are often smaller such as 0.5 ha. However, the difference creates a discrepancy between forest change maps developed with varying MMU sizes.
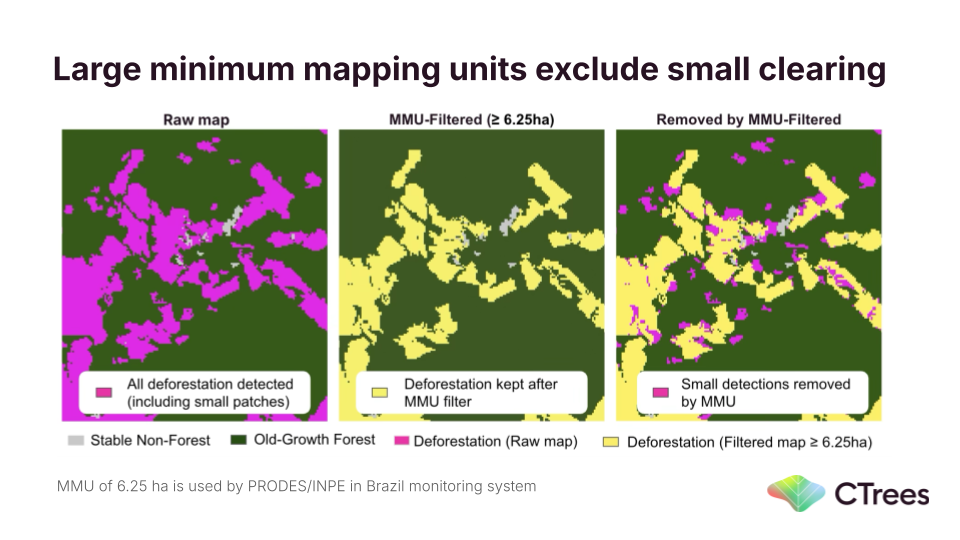
CTrees analysis shows that deforestation maps developed using large MMUs can underestimate land clearing which does not yet reach the threshold of the larger unit. In Pará, maps using a smaller 0.5-hectare MMU detected smaller areas of clearing, estimating 12% more area of deforestation than those with the 6.25-ha MMU.
Maps with large MMUs also delay detection of deforestation, as small areas of clearing take several years to progressively increase before the system classifies the change as deforestation. In Pará, for instance, the 6.25-hectare MMU map delayed deforestation reporting by an average 3.5 years.
Delayed detection can have a disproportionate effect in reference and monitoring periods for emission reduction programs such as ART-TREES and FCPF, where monitoring periods are often the most recent years, and the required period of time for small clearings to evolve to the designated MMU has still not elapsed. To make emissions estimates comparable, independent reviewers should match the MMUs in their forest change maps.
5. Infrequent land cover mapping can underestimate deforestation
REDD+ jurisdictions often report change every five years, due to limitations of imagery and technical capacity. However, five-year reports can miss forest loss and regrowth dynamics that occur in years in between.
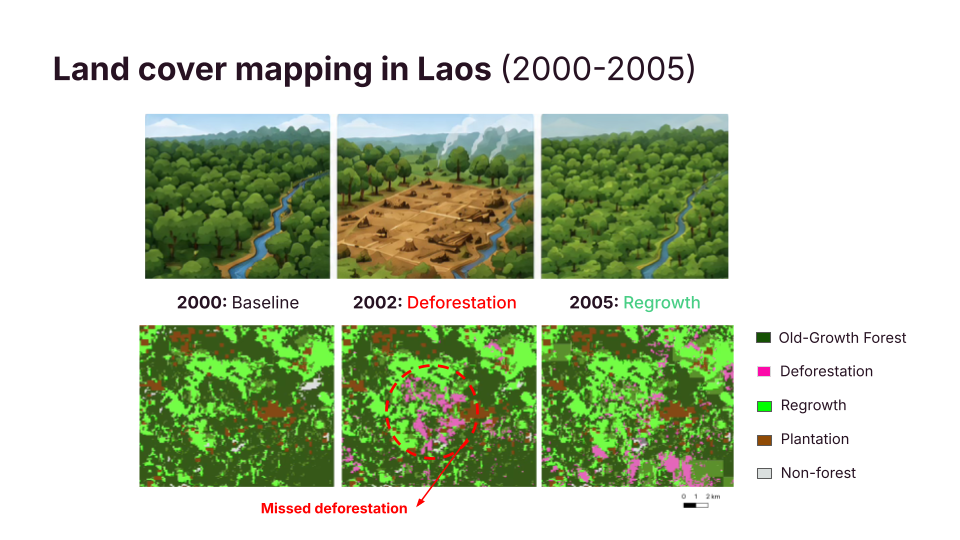
In Laos, a recent paper (opens in a new tab) found that 87% of deforestation in 1991-2020 was associated with shifting cultivation. CTrees analysis finds that forest impacted by shifting cultivation in the country recovers in 3.2 years, on average. Within that period, forest structure and carbon may not have fully recovered, but the area is perceived by the satellite sensor as forest.
When estimates take place in five-year intervals, CTrees finds 81% of deforestation is missed. Increasing the mapping frequency to every year provides a clearer picture of deforestation and degradation trends in forest landscapes.
6. Relying on one dataset can result in underestimated forest degradation
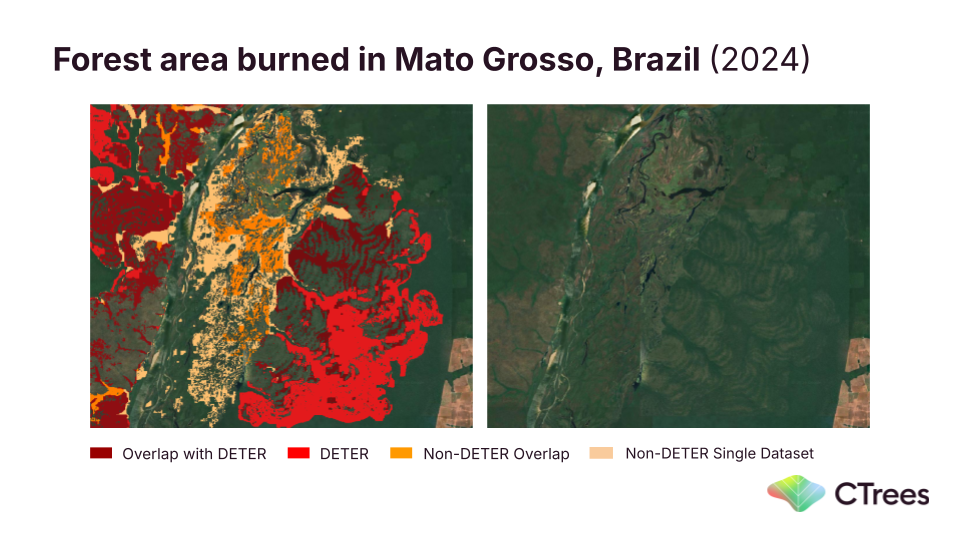
To accurately detect forest degradation due to fire, it is important not to rely on one dataset.
In Mato Grosso, Brazil, INPE’s DETER dataset is a reliable source that detects the largest amount of burned area. But CTrees analysis found DETER still omits 20% of forest fire. By combining complementary datasets to analyze the jurisdiction (e.g., MODIS and MapBiomas Fire) CTrees provided a more comprehensive picture of the areas affected by fire. Stratified random sampling further supports estimates of area burned and uncertainty levels.
7. Emission factors should account for repeated fires
Repeated fires can influence carbon emissions. In Brazil’s Cerrado biome, for example, repeated fires are common, with many areas burning more than five times in the last 25 years. Meanwhile, in the Amazon forests, some limited level of repeated fires can occur in certain regions, such as the Xingu Indigenous Park in Mato Grosso state.
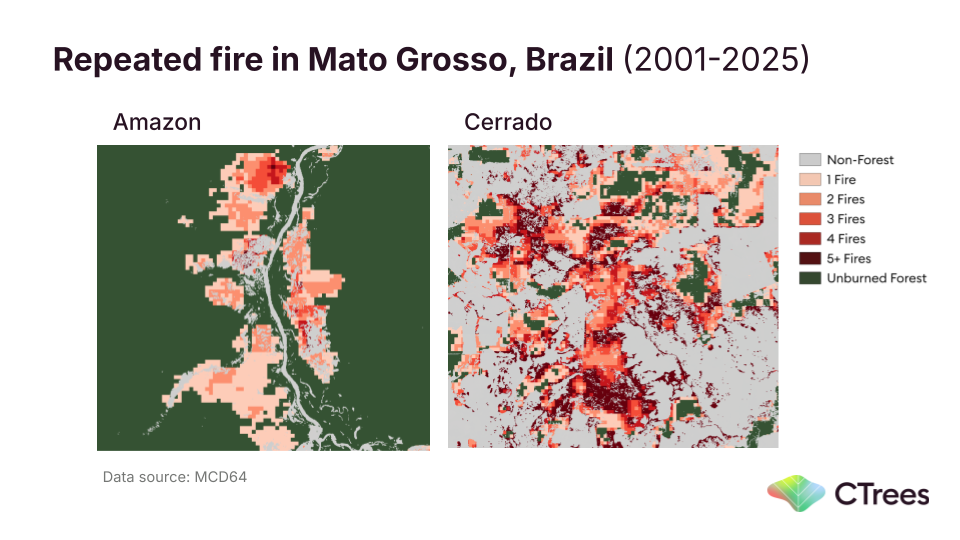
Emissions estimates that rely on a single emission factor measure only the effects of one fire. In contrast, annual emission factors calibrated specifically to the areas burned and deforested can account for differences in emissions due to fire severity, fire repetition, and aboveground biomass dynamics in affected forests.
8. Including regrowth allows for carbon removal estimates
Only a few jurisdictions that CTrees studied report on carbon removals from forest regrowth, including Laos and Viet Nam. Other jurisdictions, like Pará, are home to large areas of secondary forest whose regrowth results in significant removals not accounted for, leaving additional carbon revenue on the table.
To improve carbon accounting and calculate emission factors more accurately, it is necessary to consider forest regrowth. Emission factors should be different for areas that shift from forest to cropland, than for areas that are cleared but regrow into forest. CTrees’ hectare-level regrowth maps make detailed carbon removal accounting possible.
Independent and comparable data for JREDD+ due diligence
Overcoming these technical hurdles, and the data engineering challenge of creating jurisdictional maps of biomass and forest change, has helped CTrees produce independent datasets for effective due diligence of JREDD+ programs.
Comparability is key. As JREDD+ programs enter the market, more scientists and independent organizations are likely to produce their own evaluations. But without careful attention to matching definitions and methods, external reports may be unable to fully explain discrepancies. By bringing comparability, transparency, and scientific methods to the equation, CTrees aims to improve confidence in jurisdictions’ emissions reduction claims, and grow investment in this important nature-based solution for tropical forest countries.
If you’re interested in partnering with CTrees, please contact us (opens in a new tab). To learn more about our CTrees’ JREDD+ data offering, read the first post in this series.


