
To explore access to CTrees data on urban canopies, please email info@ctrees.org or contact us.
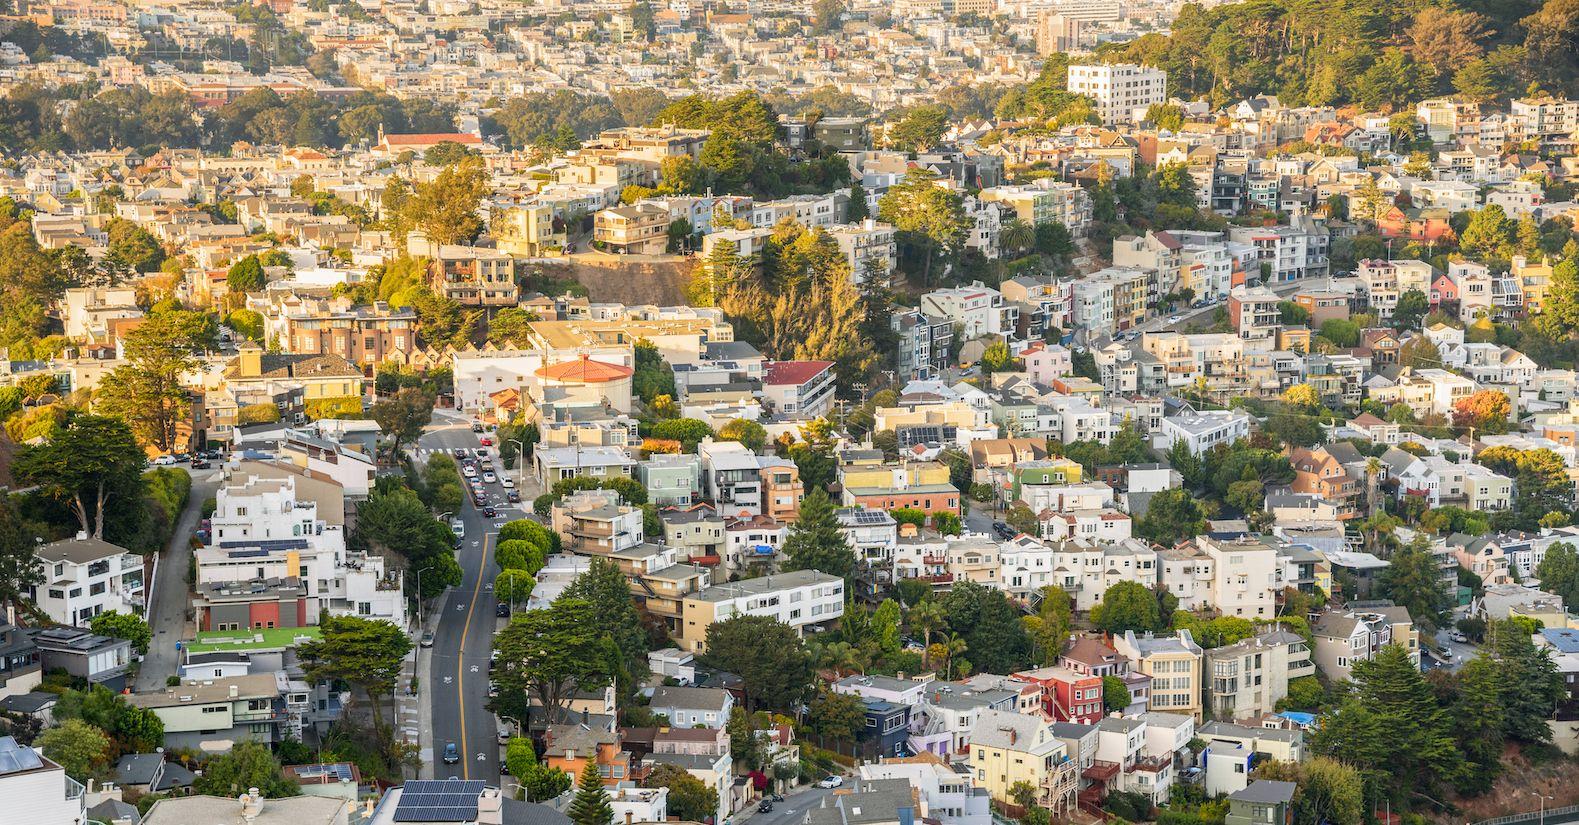
Trees scattered across a residential district in San Francisco, CA (photo by Albert Pego/iStock).
Trees in cities regulate microclimates, help reduce air pollution, manage stormwater, and absorb and store carbon.
In urban environments, trees can so strongly impact the health and well-being of residents that some experts argue they should be viewed as essential infrastructure, akin to our water and sewage systems.
But efforts to map and monitor urban canopies have long been limited by time and resources. City inventories of urban forests are often infrequent and outdated, and federal agencies have only mapped canopies in a limited number of cities.
New research from Mayumi Hirye, a research scientist at CTrees, seeks to change that.
Hirye has mapped tree canopy height and cover for the 100 largest urban areas across the continental United States, and will present her findings at AGU25 next week. The maps are one of the most detailed and comprehensive assessments of urban canopy heights in U.S. cities to date.
Hirye’s maps demonstrate a more consistent and cost-effective approach to measuring urban canopies in diverse cities and ecoregions across the country.
The research builds on Hirye’s extensive experience in urban planning and remote sensing. For the last 5 years, Hirye has also served as lead coordinator for urban research with MapBiomas Brasil, a multi-institutional initiative that aims to make knowledge about land cover and land use more accessible.
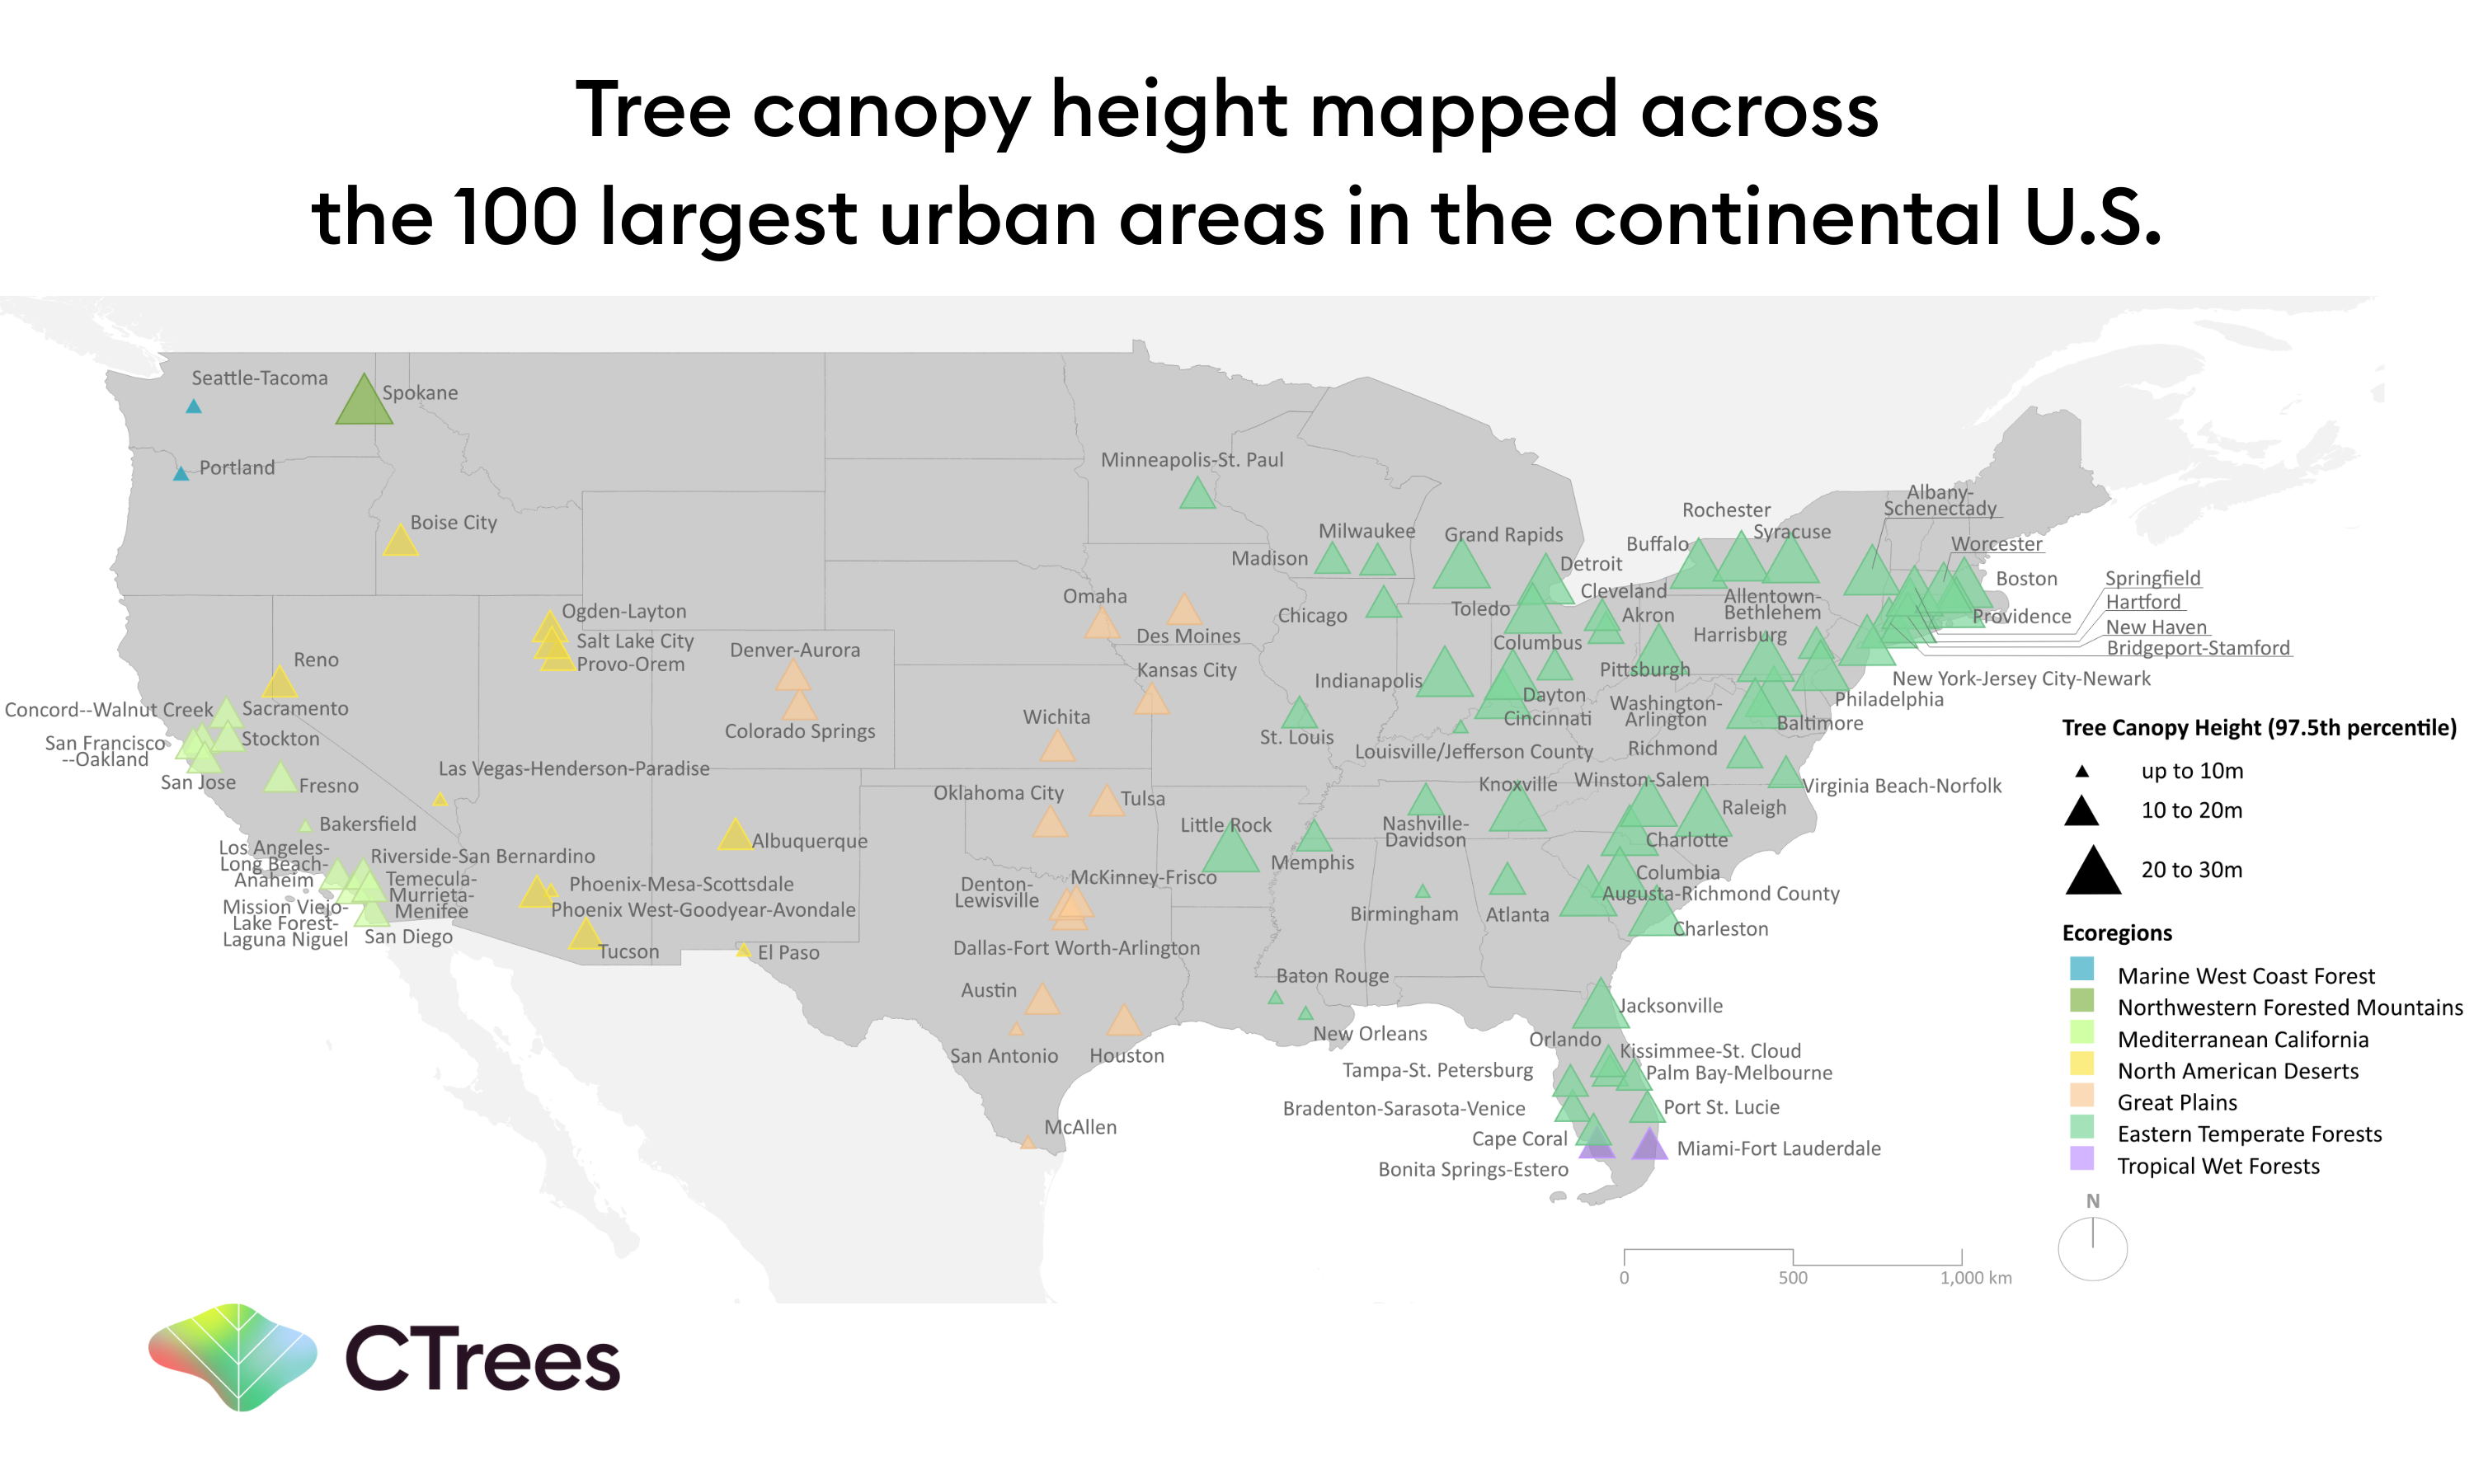
Hirye mapped tree canopy height and cover for the 100 most populous urban areas in the continental U.S., spanning 42 states and 7 distinct types of ecoregions.
To create the 60-centimeter spatial resolution maps, Hirye applied the latest advancements in remote sensing and artificial intelligence.
Specifically, she trained a U-Net deep learning model developed by CTrees scientists on aerial LiDAR data and corresponding high-resolution imagery collected by the National Agricultural Imagery Program (NAIP). She then implemented a post-processing step to better capture the complexity of urban landscapes.
Nearly one million image patches of 256x256 pixels were used to train and evaluate the accuracy of the model.
A sample of the canopy height data for several cities can be viewed via a Google Earth Engine app.
Canopy cover varies significantly by region
Initial findings from Hirye’s research reveal that Raleigh, Boston, and Spokane are the urban areas with the highest tree canopies, with maximum values exceeding 26 meters. All three cities are in regions characterized by naturally dense forest canopies, dominated by tall broadleaf deciduous trees and needle-leaf conifers.
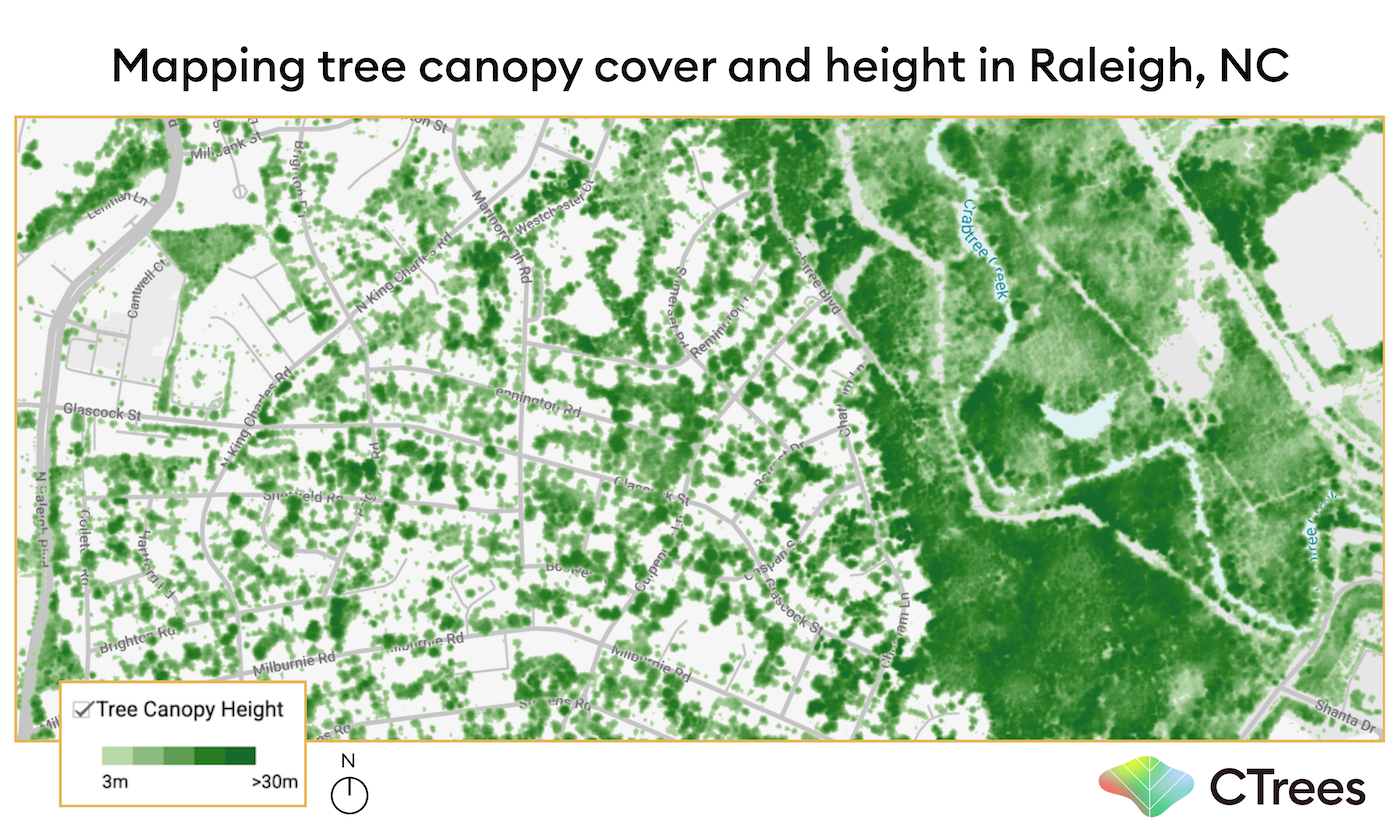
Dense tree cover and canopy height mapped in Raleigh, North Carolina.
The study also finds that tree canopy cover generally decreases from the East to West Coast.
For instance, the urban area encompassing Los Angeles, Long Beach, and Anaheim has less than 15% canopy cover—while the urban area that includes New York, Jersey City, and Newark has nearly 42% canopy cover.
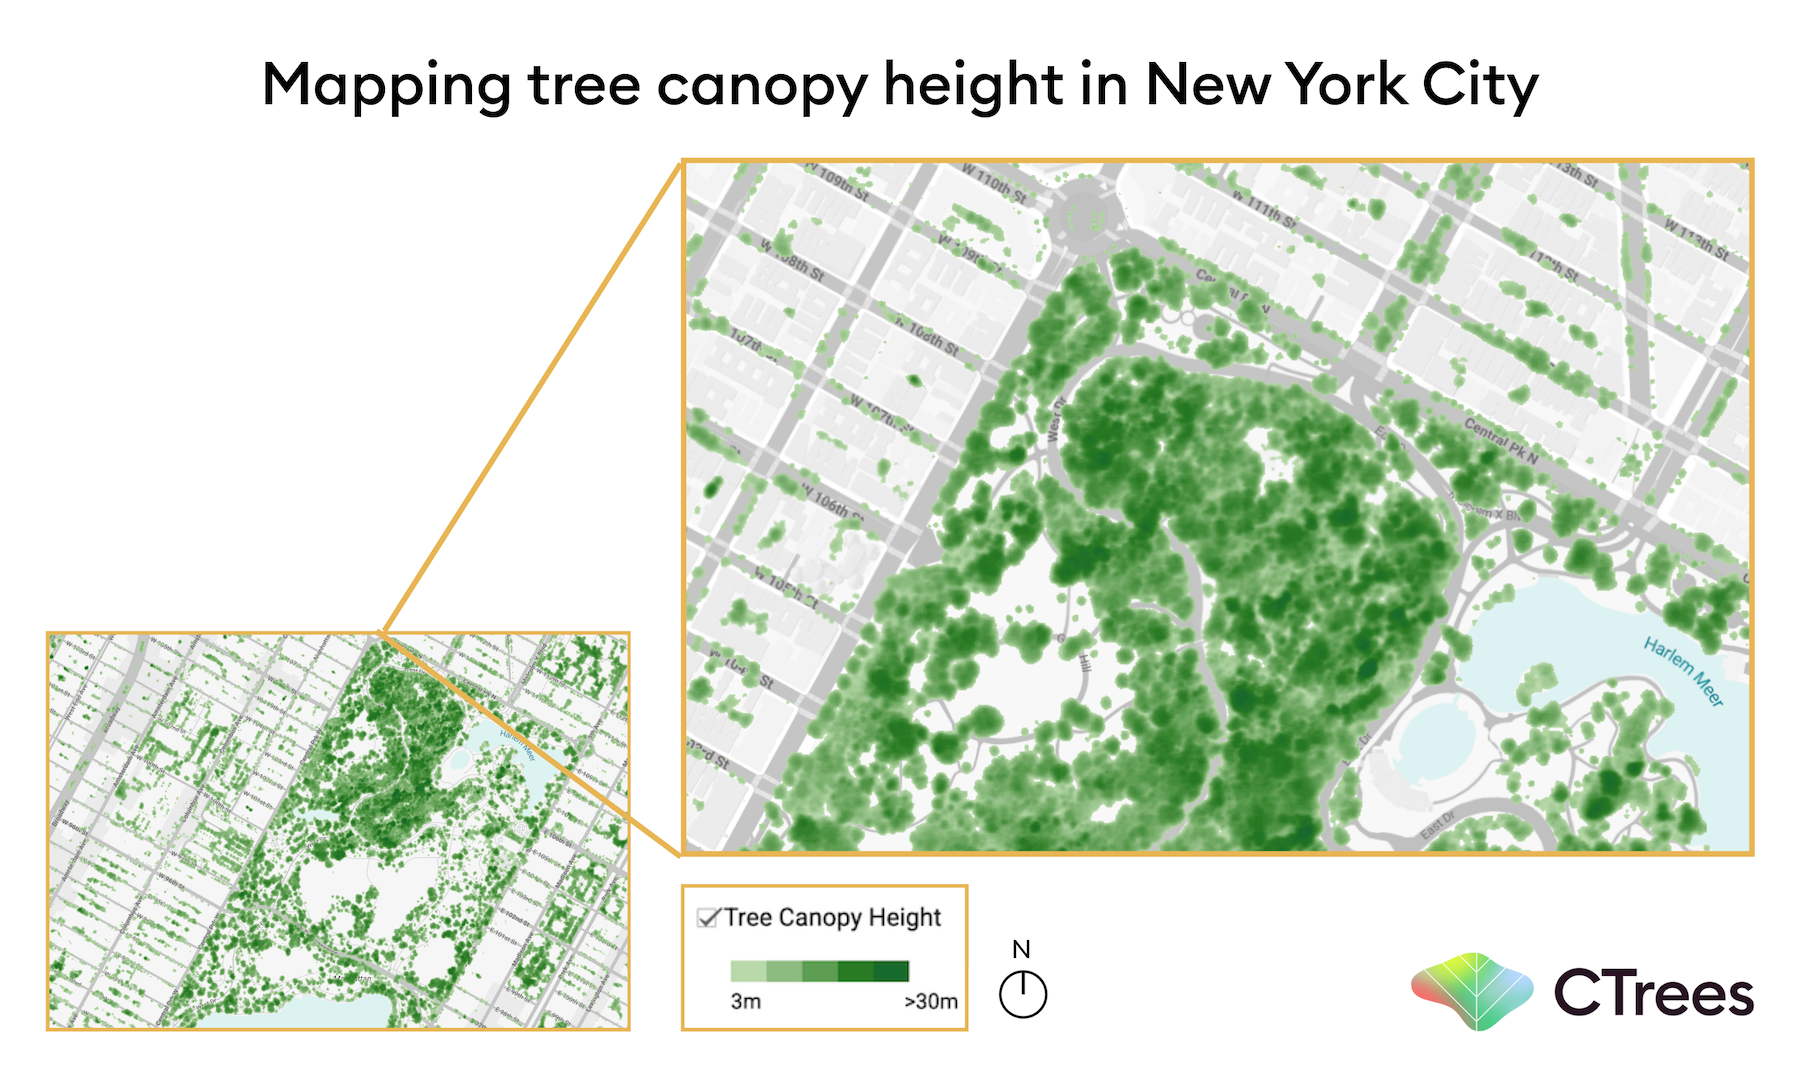
Tree canopy height mapped in and around the northern portion of Central Park in New York City.
Admittedly, the contrast between cities like Los Angeles and New York is to be expected: many Western ecoregions are naturally less forested. Still, as global temperatures continue to rise, strategic efforts to increase urban vegetation in Western cities are increasingly important.
Kansas City and Austin, with roughly 32% and 30% tree cover respectively, prove that investing in urban forests can be effective. Both cities have successfully cultivated their urban canopies, reshaping the natural grassland landscapes that once characterized the Central Prairies.
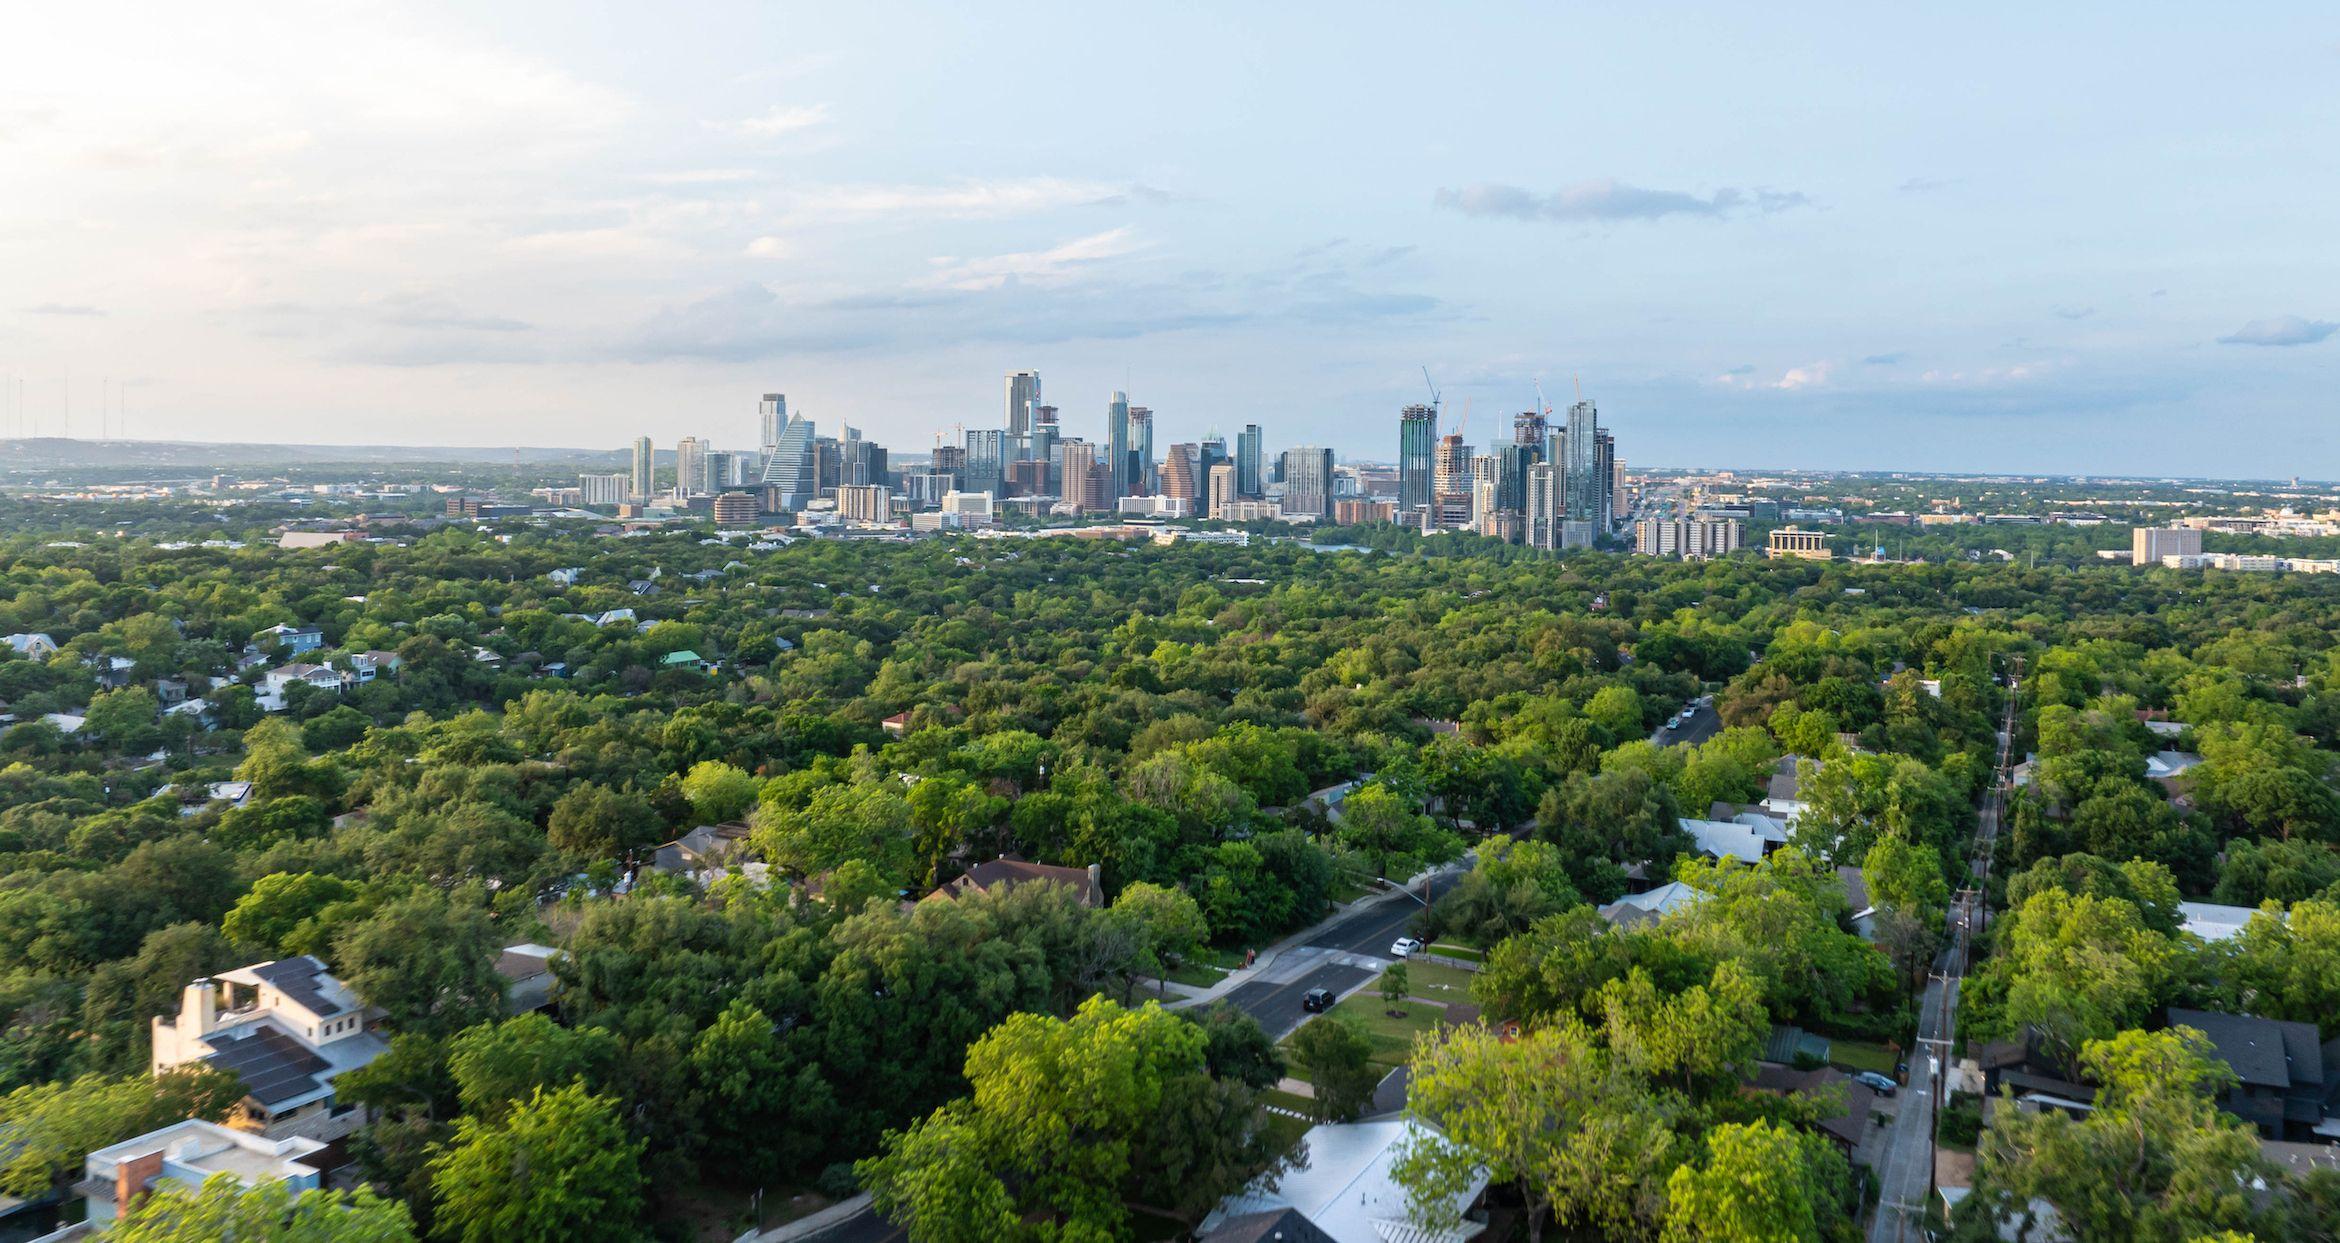
Extensive tree cover in a residential neighborhood located adjacent to downtown in Austin, TX.
A persistent data gap around urban forests
As extreme weather events continue to increase in frequency and force, cities need access to reliable data on urban trees to guide adaptation planning and boost resilience.
Detailed data on the structural characteristics of urban forests are particularly important. Metrics such as canopy height are strong indicators of a range of essential ecosystem benefits including biomass, biodiversity, and shade.
Although nationwide programs like the USDA Urban Forest Inventory and Analysis (FIA) provide critical insights on urban trees, the data is limited by a set number of sample plots in participating cities.
Meanwhile, individual cities often have inconsistent, partial, or outdated tree databases. New York City, for example, relies on thousands of volunteers to conduct a city tree census once every ten years.
For many U.S. cities, collecting detailed data on urban trees is time-consuming and resource-intensive. And given the changes and uncertainty around federal funding priorities in recent months, many initiatives focused on urban forests are likely at risk.
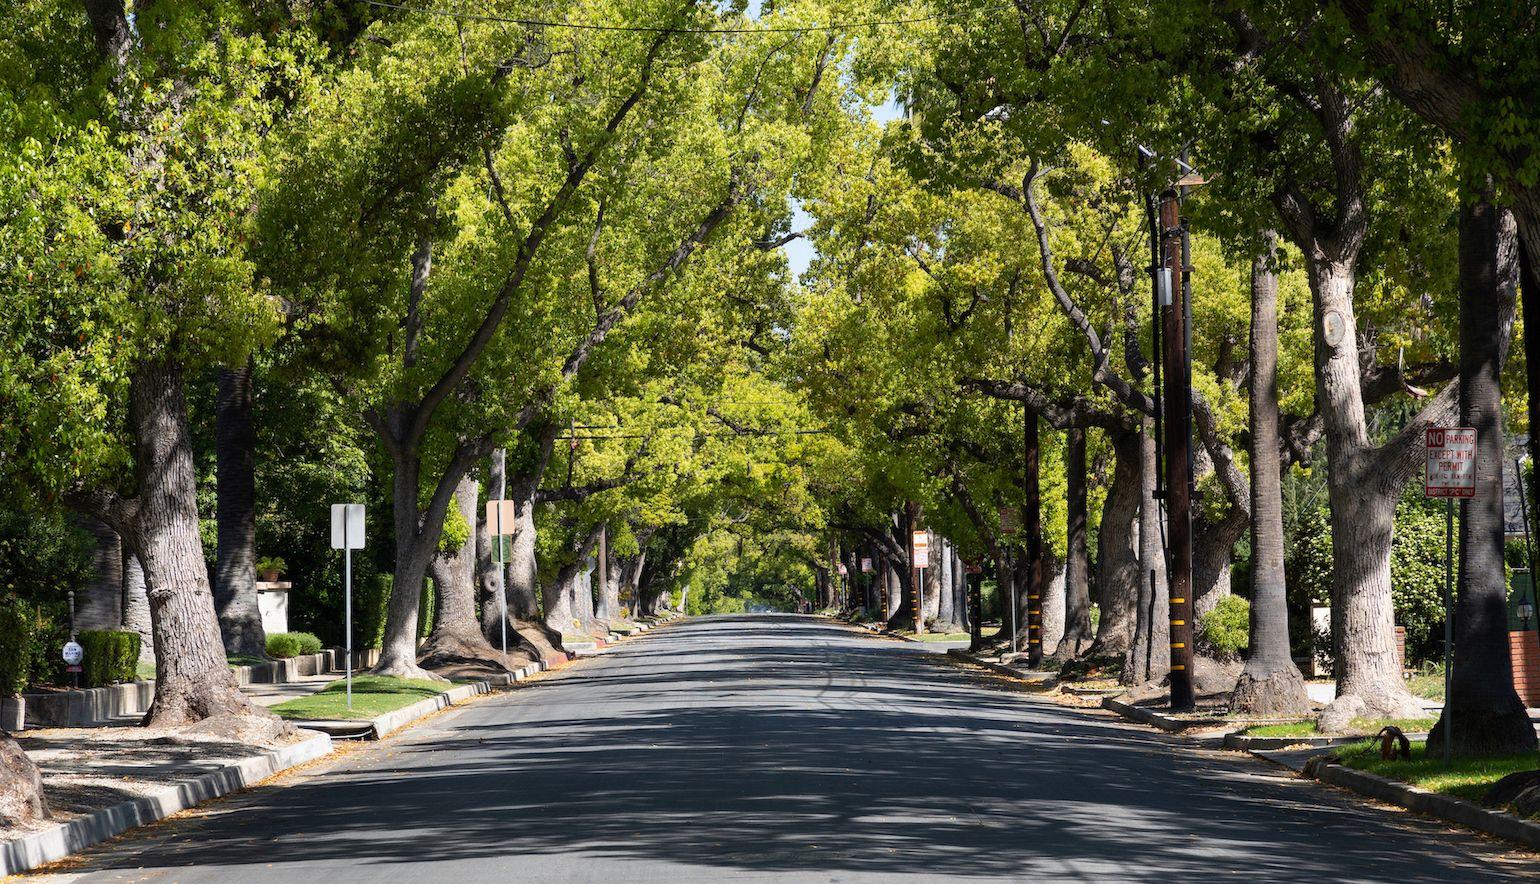
A tree-lined street in Pasadena, CA (photo by Jim Brown/iStock).
Predicting the cooling effect of urban canopies
Mapping urban trees is not just a technical exercise—it’s a crucial step towards addressing issues like extreme heat in cities.
With an estimated 80% of the U.S. population now living in urban areas, rising temperatures have become an increasingly dire issue for cities across the country.
A study of 65 U.S. cities found that the average urban resident experiences 8°F of additional heat from their built environment, as factors like building design and impervious surfaces make already high temperatures feel even hotter.
But trees can help: providing shade and reducing surface temperatures by up to 45°F.
“Trees are exceptionally good at mitigating extreme heat, but how much they reduce temperatures largely depends on canopy extent and structure,” said Hirye. “By incorporating key characteristics like canopy height into models, we can better predict the degree to which evapotranspiration and shade from a tree will cool its surroundings.”
The jarring difference in surface temperatures between the tree-lined streets of Los Angeles’ Larchmont neighborhood and the sparsely vegetated streets of East Hollywood reveals just how effectively trees can cool down urban environments, particularly on a hot summer day.
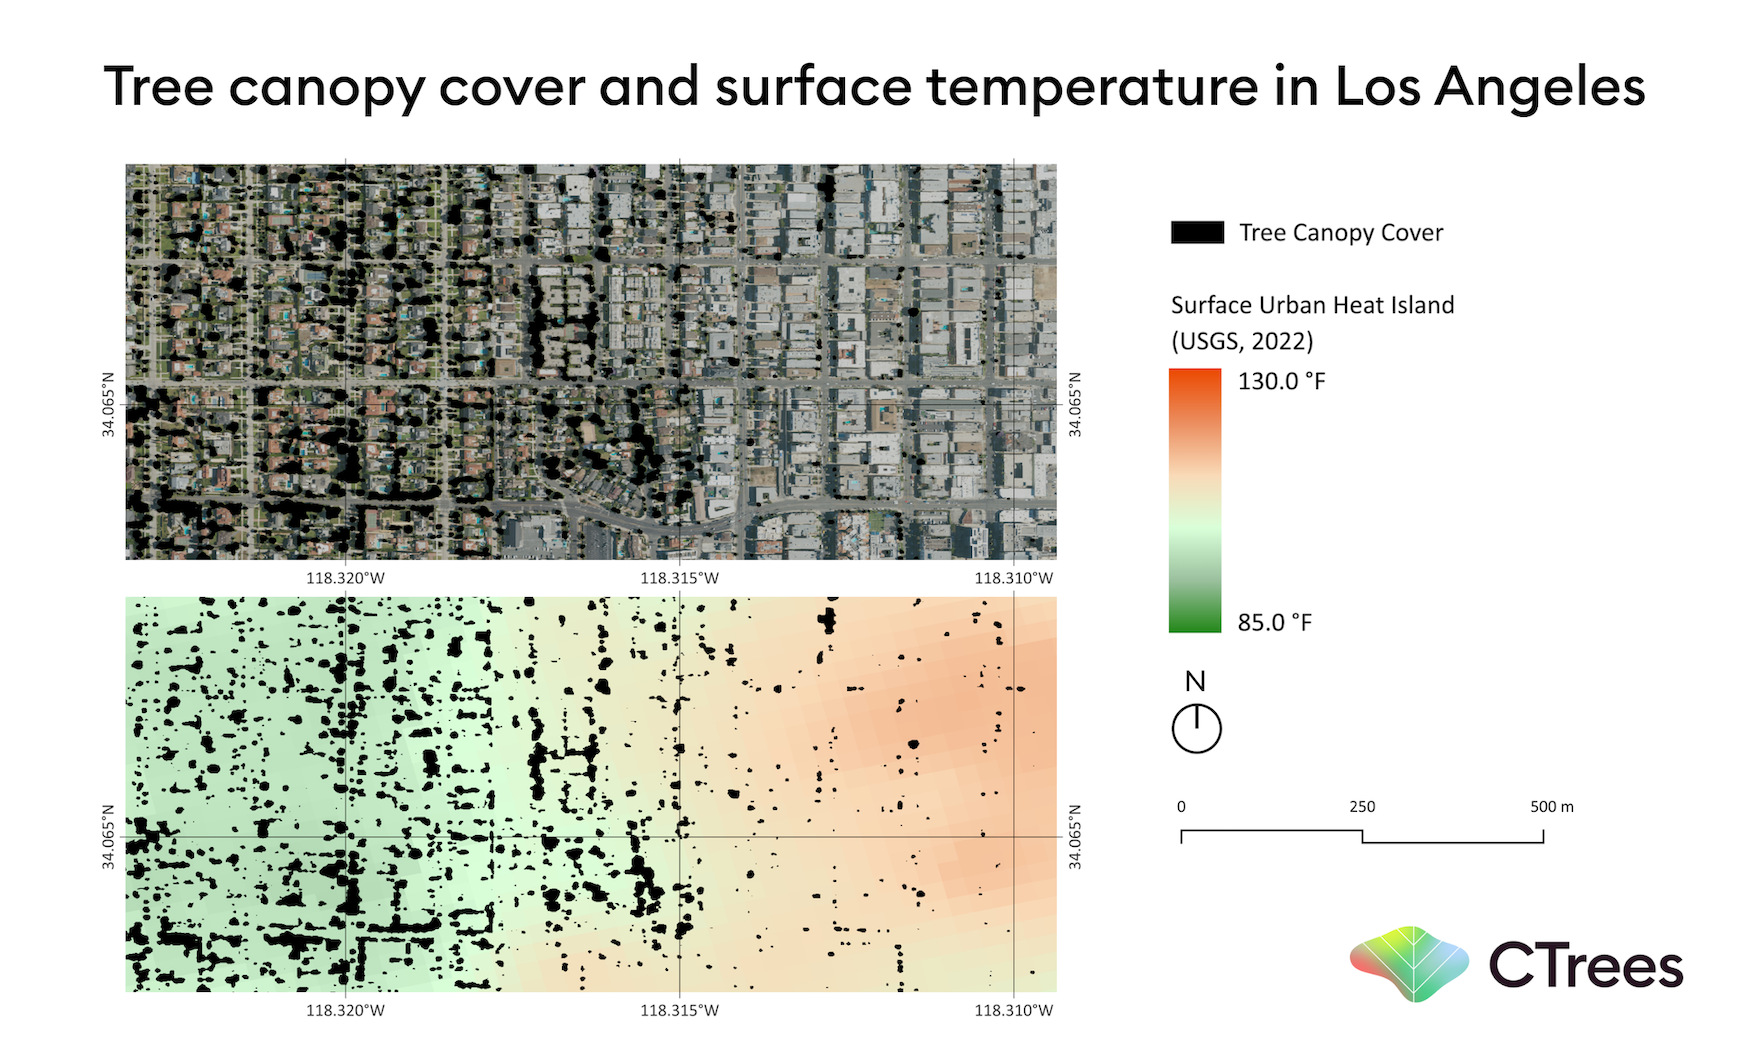
Tree cover and surface temperature mapped in two adjacent neighborhoods of Los Angeles, demonstrating the ability of urban trees to mitigate extreme heat.
At a local level, Hirye’s maps of urban trees can help city governments and environmental advocates identify gaps in canopy cover, locate areas at highest risk from extreme heat, and direct resources where they’re needed most.
“When we provide information on individual urban trees at scale, we can better understand how their cooling effects play out across entire neighborhoods or cities—and then use that knowledge to guide smarter urban planning,” said Hirye.
Resilient cities need tree-level data
As the climate crisis continues to reshape cities, trees have proven to be a simple but effective way to regulate microclimates and boost urban resilience.
Hirye’s high-resolution maps of urban canopies bring visibility to individual trees—giving cities the detailed data that they need to effectively mitigate heat, improve public health, and guide adaptation planning.
In essence, the path to more resilient and livable cities begins with a better understanding of the urban forests that sustain them.
----
If you or your organization is interested in learning more about accessing CTrees' data on urban canopies, please email info@ctrees.org or contact us to start a conversation.


