[Update Jun 13, 2025]: A recording of Naomi Provost's presentation on CTreesKit at the 2025 CNG Conference is now available via YouTube.
Scientists and data engineers working on global environmental issues face a common challenge: How to convert massive volumes of geospatial data into zonal statistics, the summary metrics for geographic areas that can help decisionmakers evaluate trends, like rates of deforestation in the Amazon or emissions from wildfire in California.
CTrees aims to address this data challenge with CTreesKit: a new open-source Python package that offers a more efficient way to process large amounts of geospatial data and develop zonal statistics. The package can now be accessed as a beta version through a public repository on GitHub.
Naomi Provost, head of engineering at CTrees, led development of CTreesKit. In her role, Provost leads a team that develops code to transform scientific models into actionable datasets.
CTrees' REDD+AI platform is one example of this work. The open data platform converts satellite imagery and machine learning predictions into maps of tropical forest degradation, then into charts and metrics for specific boundaries – like the annual area of degradation from logging in Peru for 2017-2023 (pictured below).
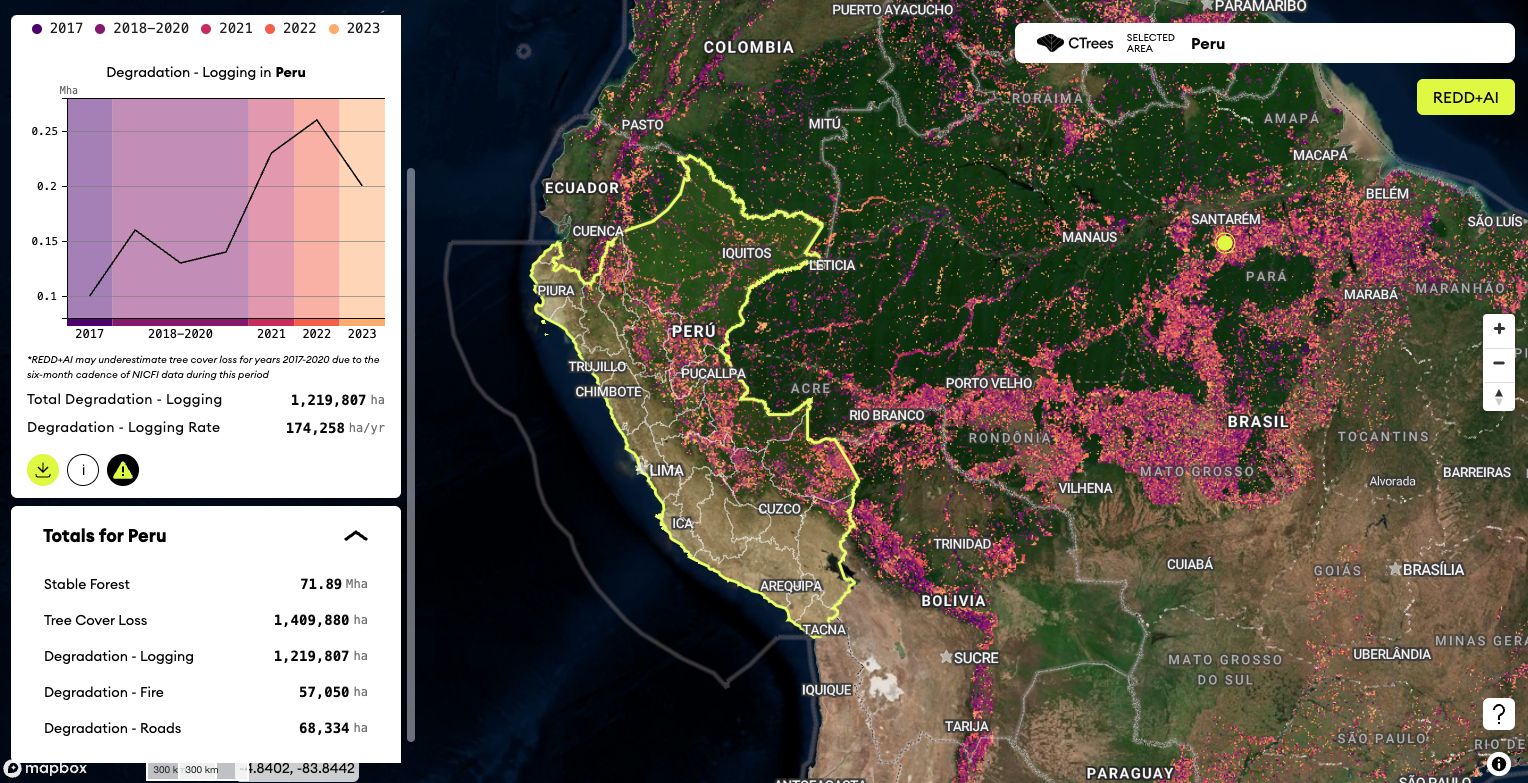
CTrees’ REDD+AI platform measures forest degradation from logging, fire, and roads in any tropical forest globally.
Provost presented on CTreesKit and discussed CTrees' cloud-based approach to managing geospatial data at the CNG conference in Snowbird, Utah, this week.
CTrees communications manager Rachel Kovinsky sat down with Provost to learn more about the open-source tool:
Rachel Kovinsky (RK): Why do you see this type of tool as valuable for people and organizations working on natural climate solutions?
Naomi Provost (NP): A lot of climate data currently exists in formats that are difficult to access and understand. One way to make this data more digestible is to use zonal statistics to turn complicated maps into clear metrics.
CTreesKit helps with this process by extracting values and turning them into CSVs, which can then be quickly converted into charts and graphs.
CTrees’ REDD+AI and JMRV platforms are good examples of the power of zonal statistics. Both provide metrics at multiple administrative levels – including at the country, state, province, or county level – with charts that clearly illustrate trends within an area over time.
Put simply, open-source packages like CTreesKit can assist with making climate data easier to interpret and more accessible for the decision-makers who need it most.
RK: What exactly is CTreesKit and what was it designed to do?
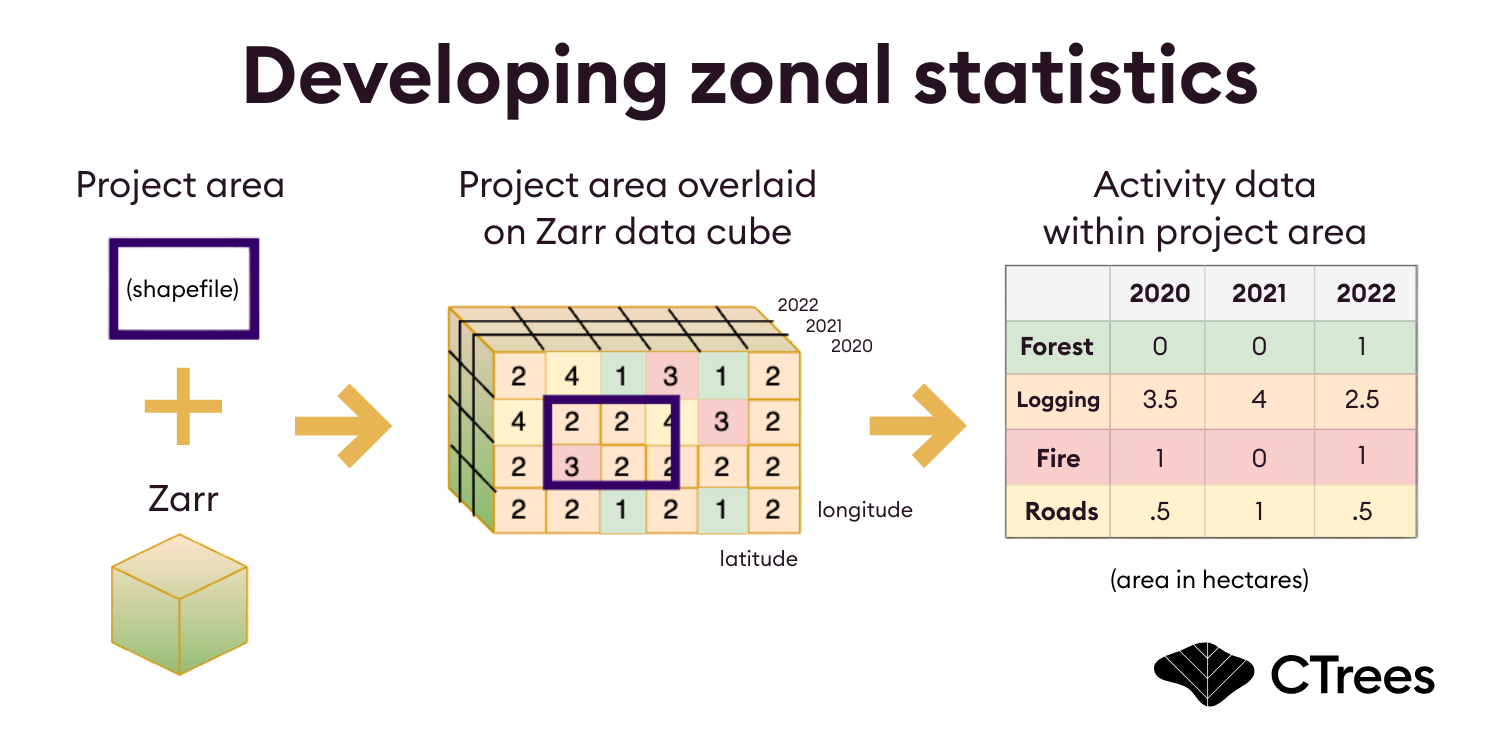
NP: The CTreesKit package has two parts. The first is what I call “Arraylake tools,” or a set of functions that allow people to convert data from GeoTIFF to Zarr format. You can think of a GeoTIFF as a map made up of pixels, with each pixel holding a value tied to a real-world location. Meanwhile, a Zarr is best understood as a bunch of GeoTIFFs stacked together, but sliced and organized so that you can quickly access any piece at any time.
CTrees recently partnered with Earthmover, a startup focused on scientific data and cloud computing that created Arraylake, to make this process simpler, but the “Arraylake tools” functions could also be used with their existing open-source Icechunk library.
The second part is what I call the “XR analyzer functions,” which use Rioxarray [a Python toolbox for handling large amounts of geospatial raster data, like satellite imagery or elevation maps] to conduct zonal statistics.
Currently, each CTrees scientist is using their own method to generate zonal statistics – whether that’s through a GDAL package, R, Python, QGIS, and so on – and there’s often slight differences in their approaches. Through the CTreesKit package, I have created a shared and standardized way for everyone to run their zonal statistics.
RK: You said that CTreesKit can help convert from GeoTIFF to Zarr format – why is that important?
NP: At CTrees, we create a lot of time series and the one limitation of a GeoTIFF is that it’s two-dimensional. When you have a time series, you essentially have a folder of GeoTIFF files where the date is included somewhere in the file name – but there are no naming standards. This means that you have to manually look at each file name to figure out which date the file refers to.
In contrast, a Zarr format is a multi-dimensional array that lets you combine time and geospatial aspects with attributes. When used with Arraylake, Zarr allows you to embed metadata.
For example, for one of our GeoTIFFs, we'll have something like “1 equals forest, 2 equals non-forest,” so on the GeoTIFF you have to have an additional metadata file. But using a Zarr format with Arraylake, you can embed that information directly into the data. This consolidates data and makes it much easier to run analysis across time.
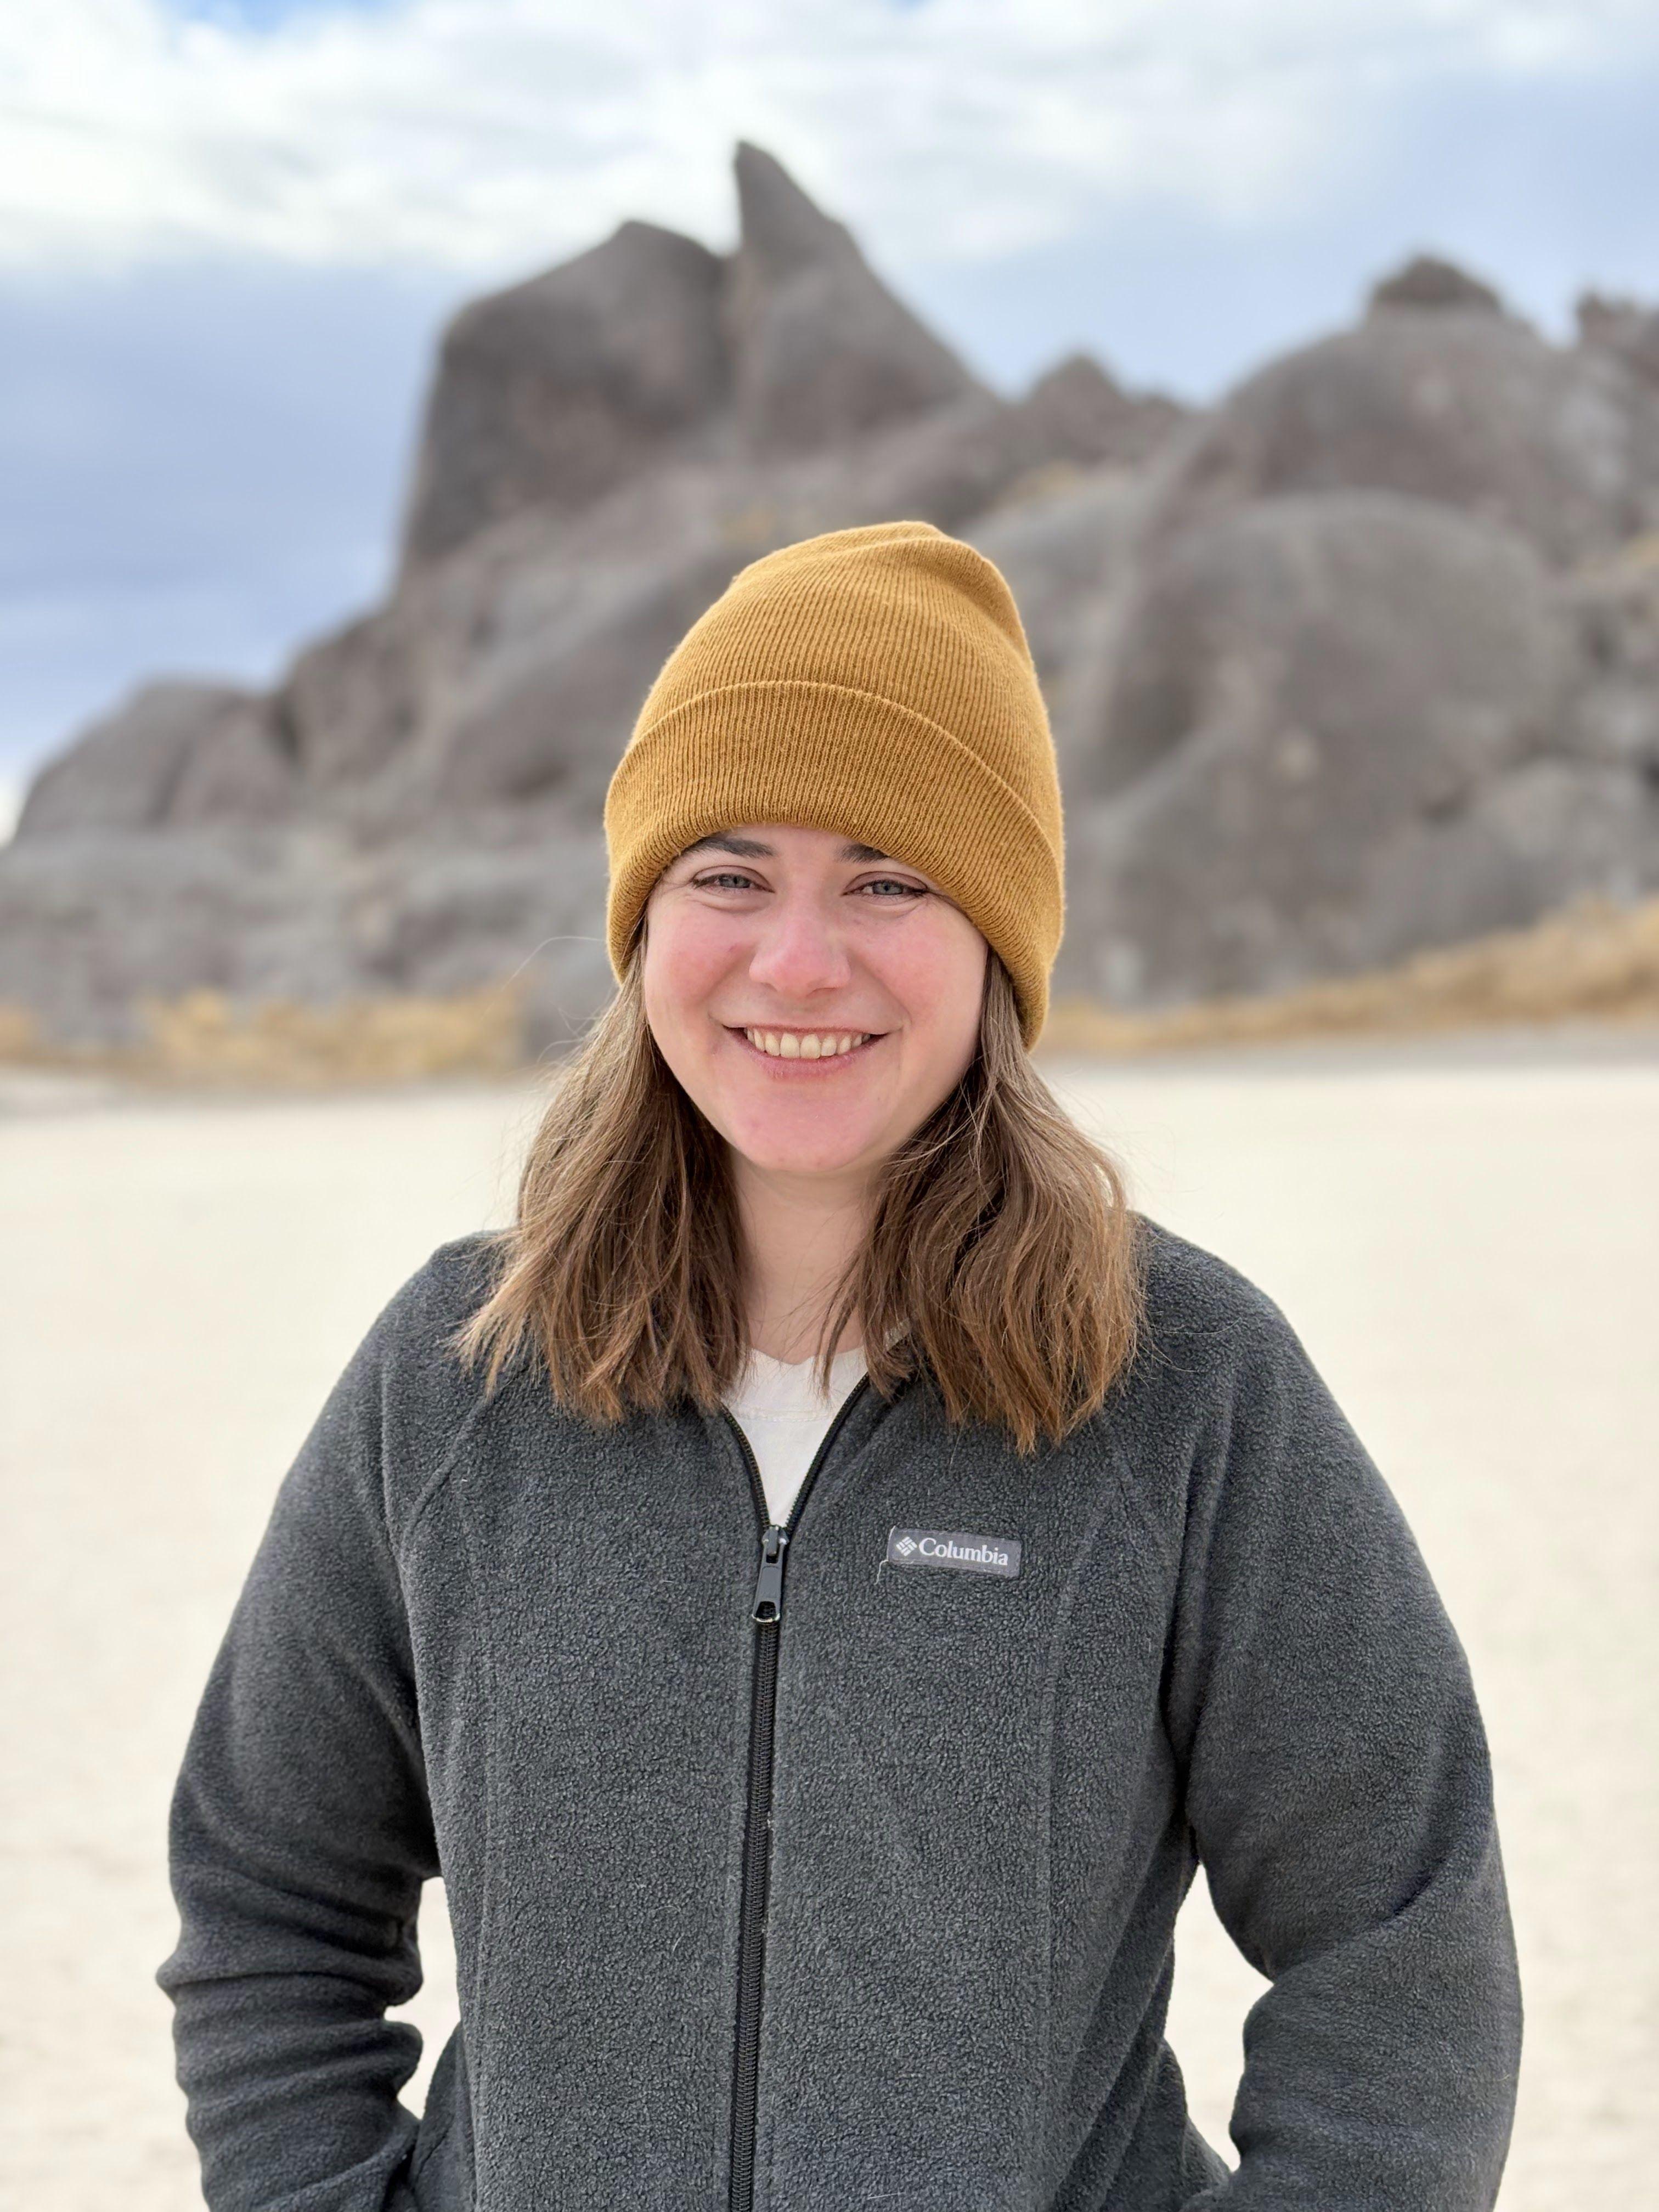
CTrees head of engineering Naomi Provost
RK: Why did you start working on CTreesKit? What challenges motivated your work on this package?
NP: As an engineer, I spend a lot of time working with code from our scientists and helping them parallelize or optimize it. I've noticed similarities in scientists’ coding process when running analyses, even across different coding languages and Python packages.
It became increasingly clear that CTrees needed a shared Python package that incorporates the newest cloud-native geospatial libraries, and can be standardized across all of our science code.
Another reason that I developed this package is to bring greater transparency to CTrees’ methodologies and analytics. Providing insight into our processes is important for the scientific community, and for future innovation. As a science nonprofit, transparency is a core value – and having this open source package is a direct reflection of that.
RK: How do you anticipate that people, inside and outside of CTrees, will use the package?
NP: The main use case is for data scientists and analysts who need to run zonal statistics on raster data [geospatial data stored in pixels].
For example, scientists who want to find the area of each category in a set of raster data, or who want to conduct a time series analysis. CTreesKit can make those processes more efficient.
RK: How is CTreesKit different from other available code packages?
NP: In the geospatial world, a lot of people use GDAL, which is a very large package built on C++. As a software engineer working in the cloud, I'm always trying to find systems that are lightweight and fast. This is particularly important when working with large global datasets.
CTreesKit uses Xarray [a Python library that helps organize, analyze, and work with multi-dimensional data] and Rioxarray, which means that scientists and engineers won’t need to install the full GDAL package onto their computer.
CTreesKit also lets you use Dask, a tool that helps computers work on really big tasks by splitting them into smaller parts and running them in parallel. This is necessary and helpful when processing large global datasets on local machines.
In other words – CTreesKit is lighter, cheaper to host, and faster to use when working with large amounts of geospatial data.
RK: What challenges did you face in building this package?
NP: Learning Xarray and Rioxarray! I had not really used either of these packages before, so I had to spend a lot of time learning them. Thankfully, the engineers at Earthmover were really helpful throughout that process.
RK: Is there anything else that you’d like to share about the future of your work at CTrees?
NP: This package is something that I'm excited to build on top of. The more I can look into the scientist’s code, the more I can find standardized ways to streamline our processes at CTrees. As an engineering team, that’s key to getting stuff done faster.
Additional Resources
Access CTreesKit
Learn more about Earthmover


