
California is home to an extraordinary variety of trees in diverse landscapes: from valley oaks dispersed in foothills across the state, to rows of orange trees across Central Valley farms, and coastal redwoods that can stand more than 100 meters tall, among the tallest and most carbon-rich trees in the world.
Measuring the height of an individual tree is key to estimating its biomass and carbon content. And measuring the height of all of California’s trees would provide insights into the state’s carbon stock in forests and isolated trees. To date, conducting such studies has required tedious measurements from the ground, or expensive lidar campaigns from planes that can only cover limited areas. As a result, the height of all trees across the state has been elusive, limiting understanding of the full scope and variance in California’s natural carbon resources.
Now, scientists at CTrees have comprehensively mapped the height of all California’s trees by applying a deep learning model to very high resolution aerial imagery from the USDA’s National Agriculture Imagery Program (NAIP). The efficient approach has produced the most accurate map of California’s canopy height to date, outperforming other models that use commercial imagery or more intensive computing resources. The methodology and results were published today in Remote Sensing of Environment.
The study finds that in 2020, the most recent year of NAIP imagery, trees taller than 5 meters covered ~19.3% of California. The model successfully estimated canopy heights up to 50 meters tall, and found that among California’s forests, 0.7% had a median height of 40 meters or above, representing the most biomass- and carbon-rich areas of the state.
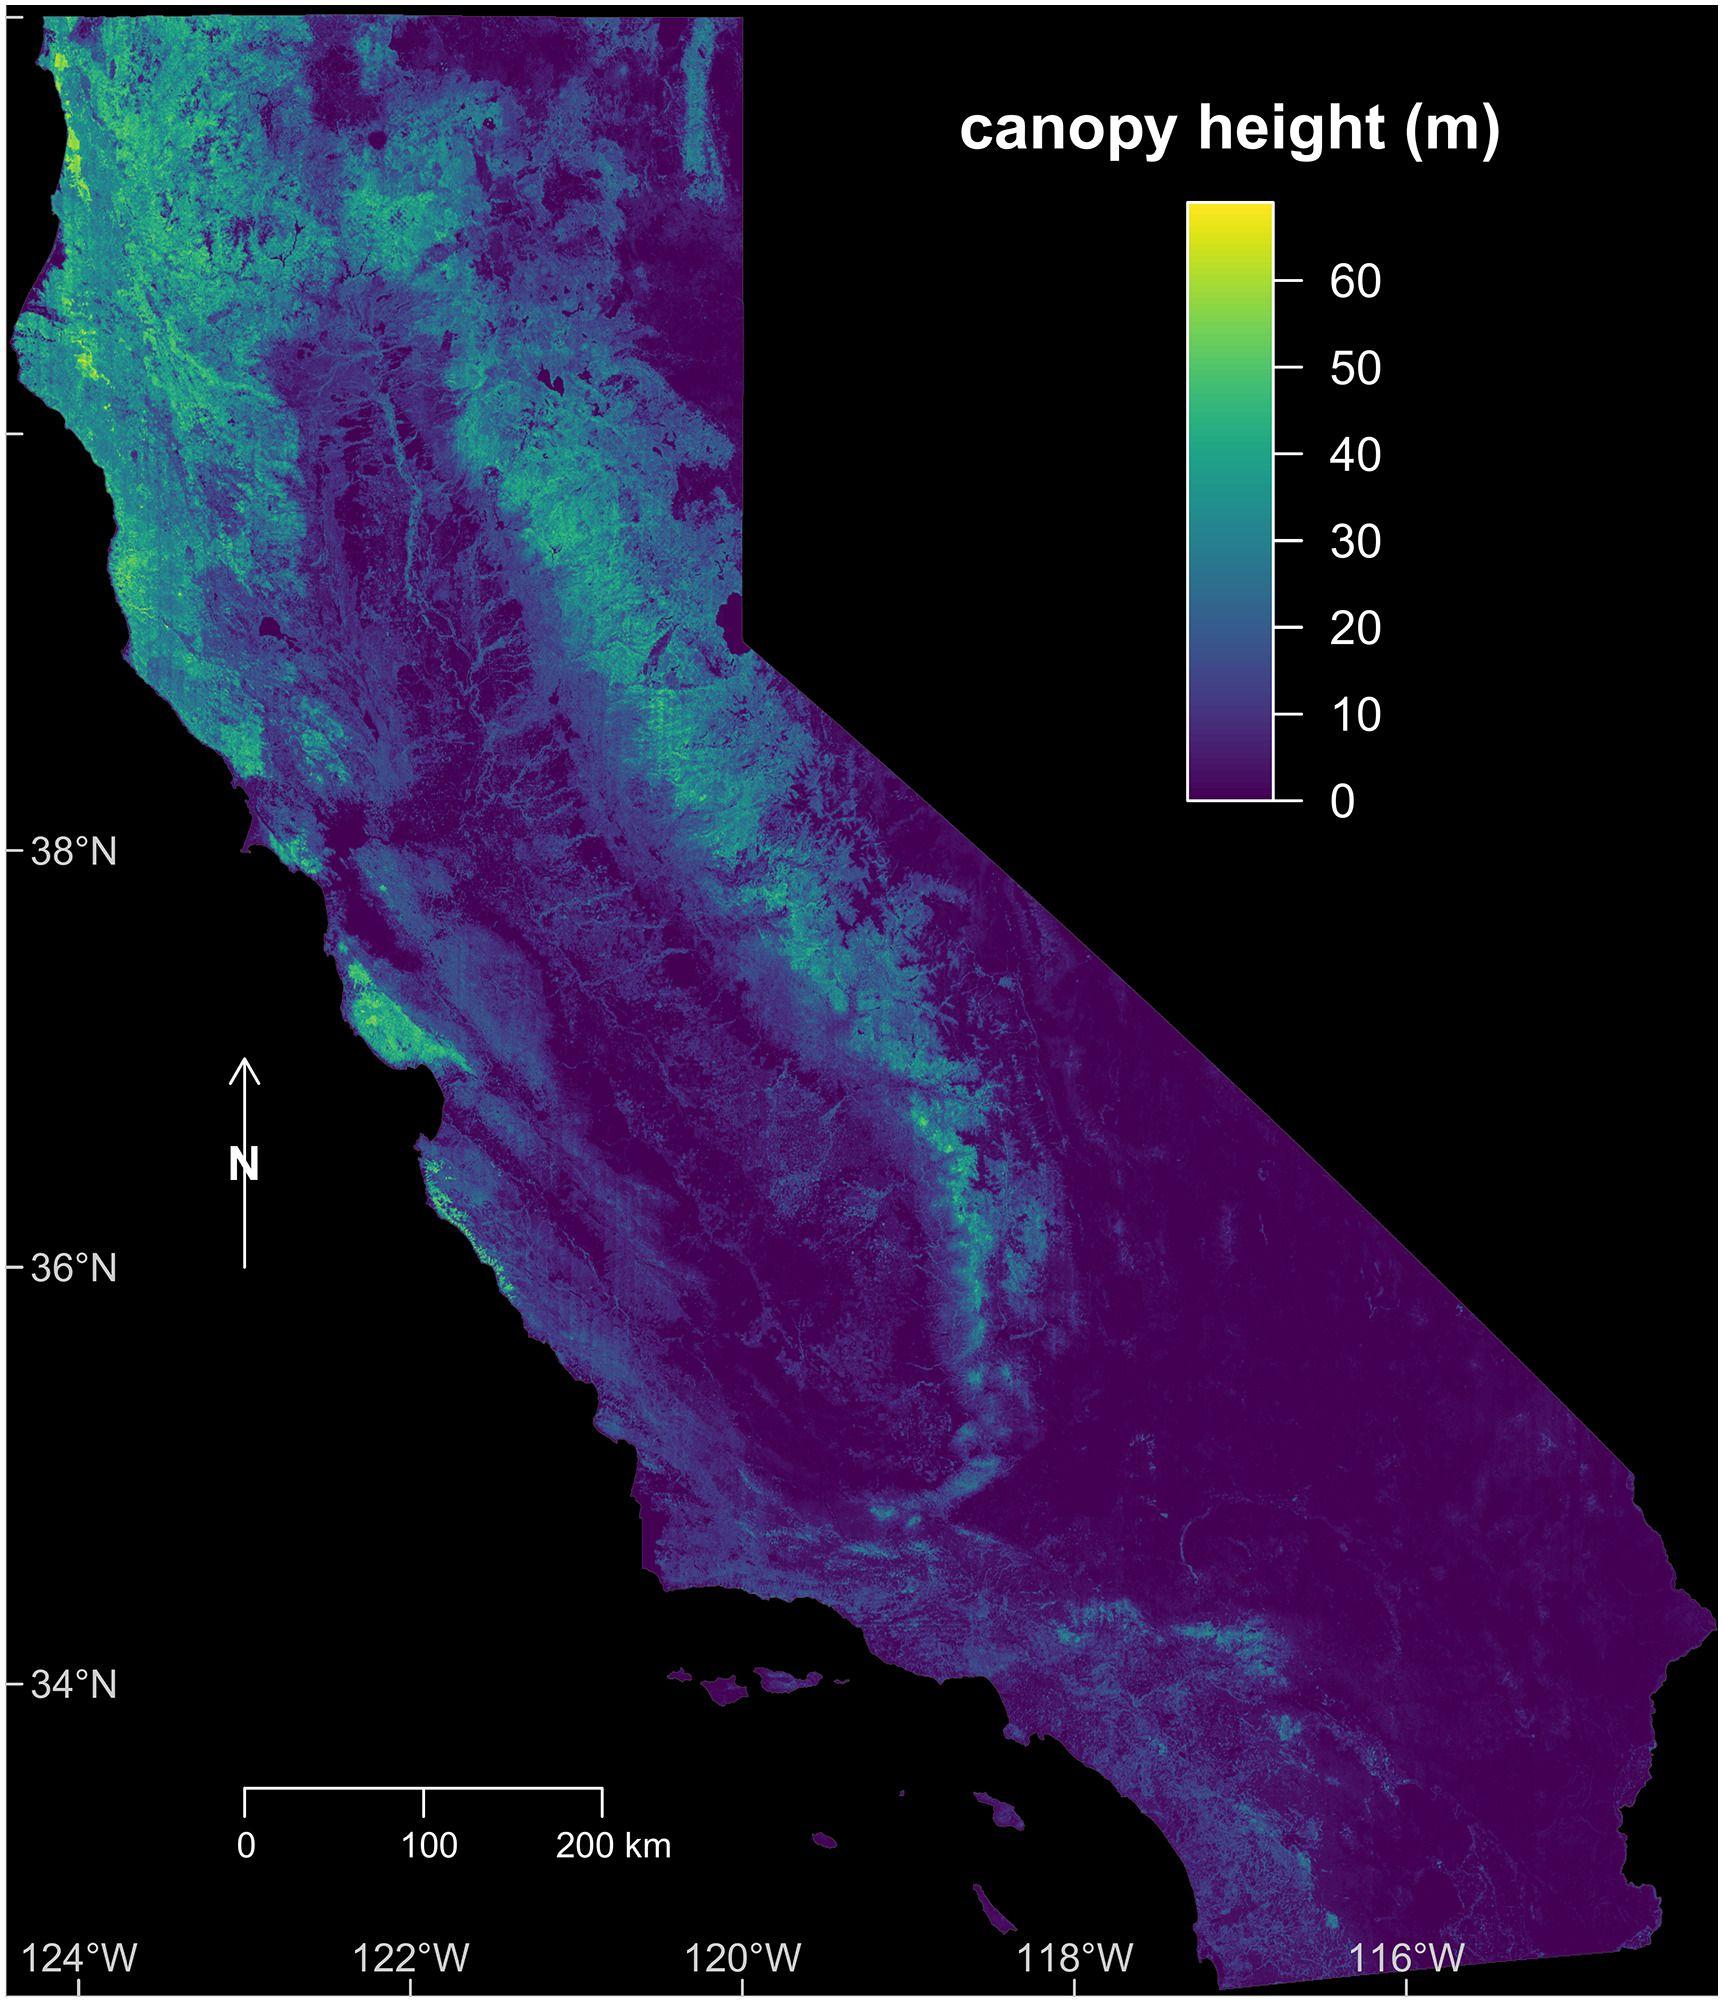
A canopy height map of California shows the distribution of tree heights across the state.
The study was led by Dr. Fabien H. Wagner, a research scientist at CTrees and a postdoctoral researcher at the UCLA Institute of the Environment and Sustainability. Co-authors of the paper include CTrees scientists and collaborators Sophie Roberts, Alison Ritz, Griffin Carter, Dr. Ricardo Dalagnol, Dr. Samuel Favrichon, Dr. Mayumi Hirye, Dr. Martin Brandt, Dr. Philippe Ciais, and Dr. Sassan Saatchi.
Dr. Saatchi, CEO of CTrees and a scientist at NASA Jet Propulsion Lab / Caltech and UCLA, said, “This study shows the potential to accurately map and monitor tree-height across an entire state at relatively low cost, providing critical insights to help government and organizations fighting to protect the state’s biomass and carbon resources from the threats of climate change and human activity.”
To produce the map of California’s canopy height, the scientists start with an aerial image at 60 centimeter resolution from the NAIP program, a public dataset that covers the entire U.S. every two years. As a reference, the scientists use canopy heights computed with elevation data from U.S. Geological Survey (USGS) and The National Ecological Observatory Network (NEON), which are only available for some areas. The scientists’ machine learning model uses a deep learning algorithm called U-Net, that, when trained with thousands of examples, can learn to transform an image into another image using mathematical operations. Here, the model learned to transform the aerial NAIP image into a canopy height model image.
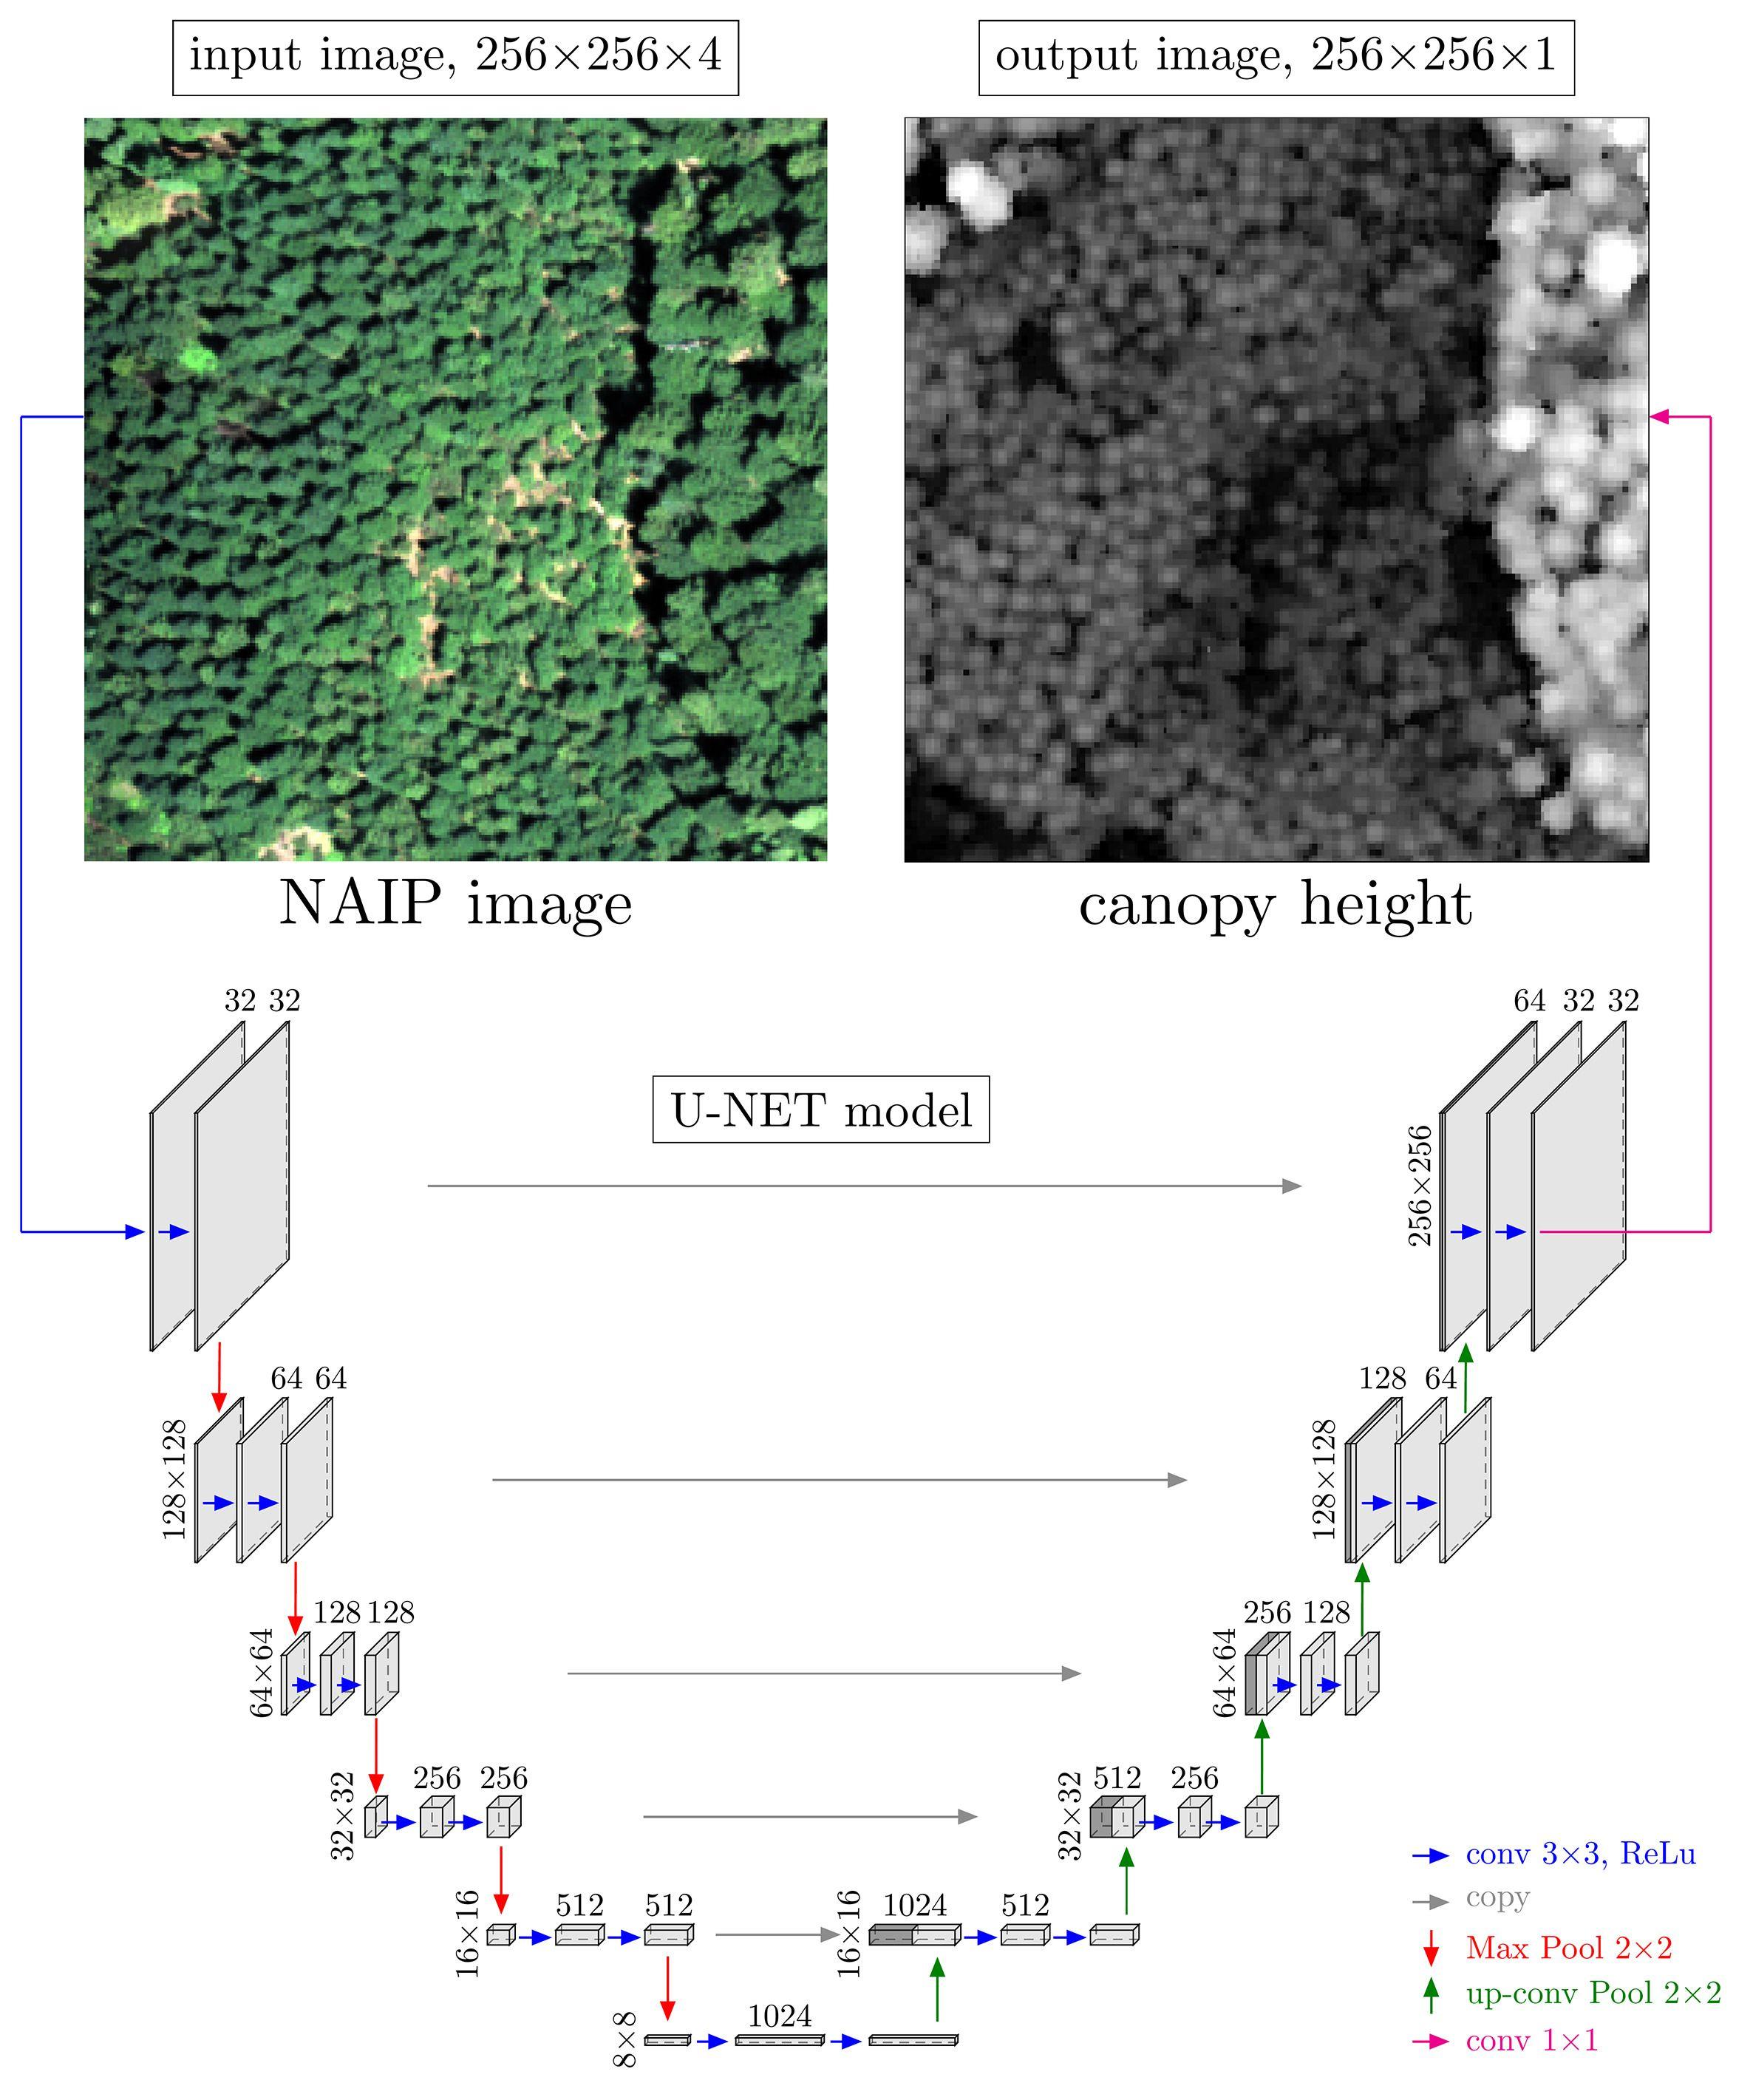
The model uses a U-Net architecture to transform a 60-centimeter aerial image from the NAIP program into a canopy height model image.
Previous studies relied on datasets with a lower resolution that could not capture the full variety of trees in places like California. Global canopy height maps using GEDI data at 30-meter resolution, or Sentinel data at 10-meter resolution have scientific applications, but are not suitable for local forestry applications because of their coarser resolution and large uncertainty. The measurements also tend to underestimate the height of the tallest trees.
Another recent California canopy height model from researchers at Meta applied deep learning approaches to 50-centimeter satellite imagery from Maxar, a commercial satellite firm. Training their model required use of multiple high-end GPUs, presenting a challenge for other scientific research groups to replicate the approach.
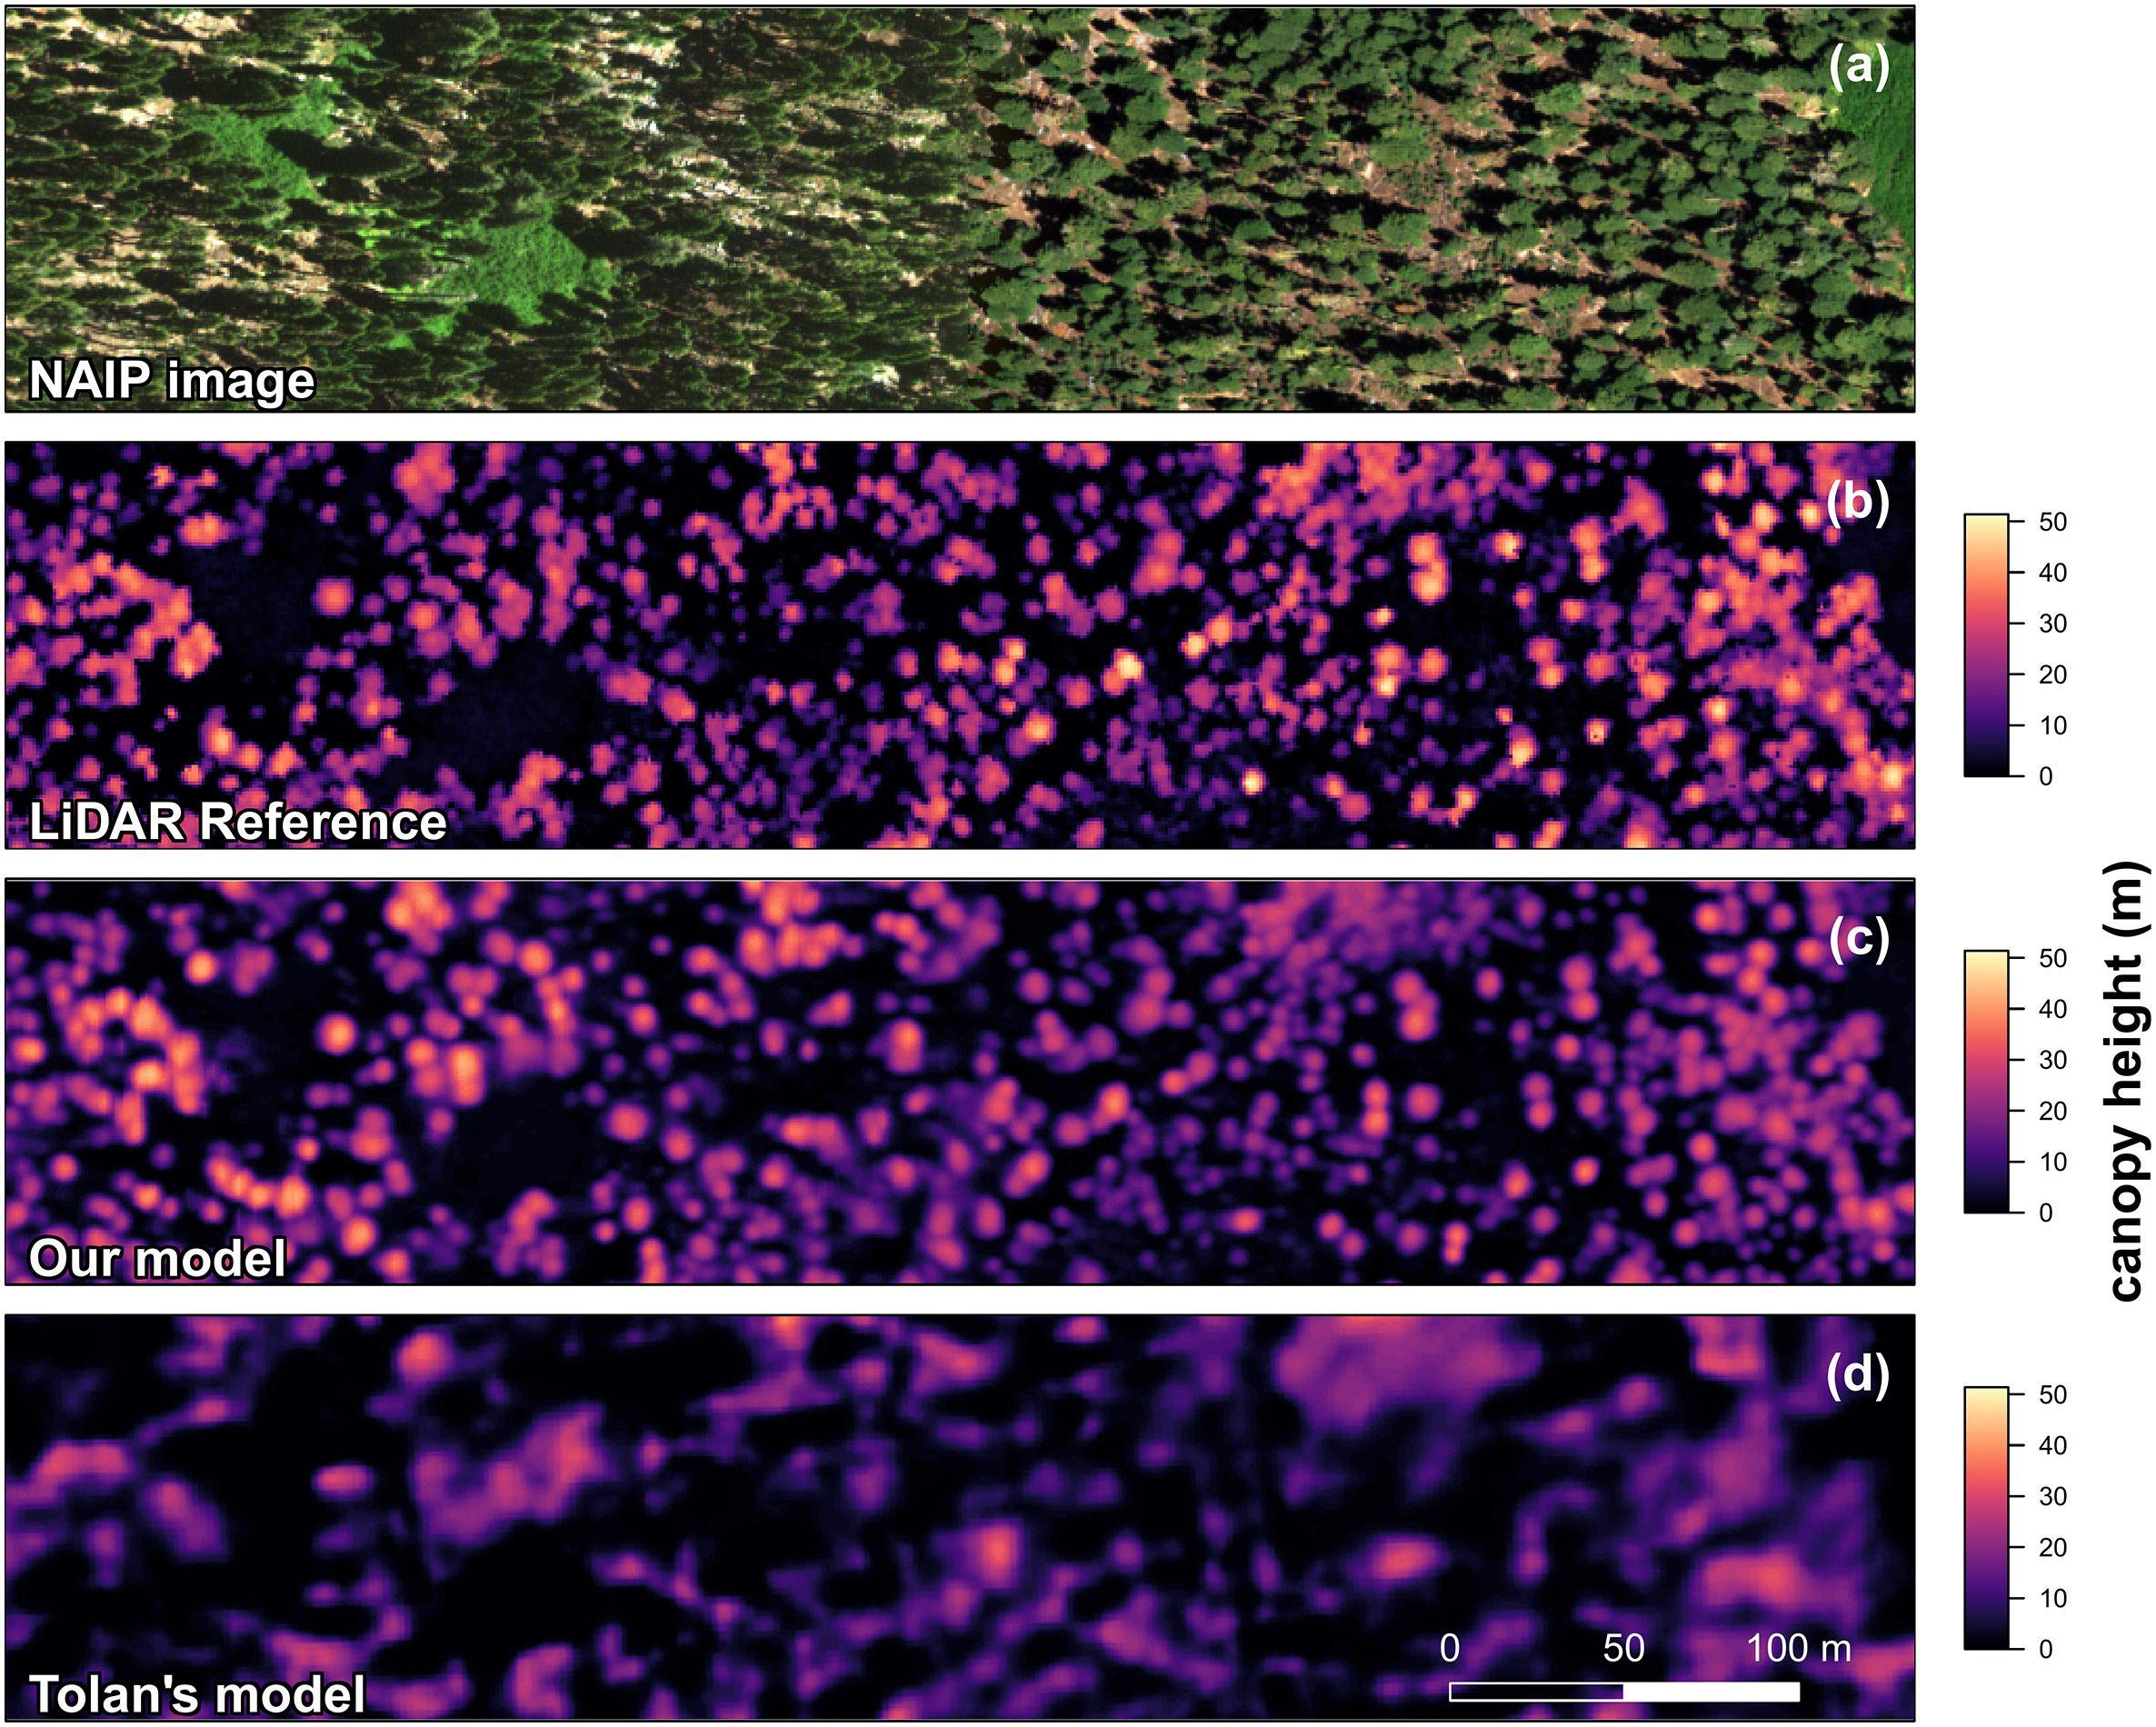
Comparison of canopy height estimation results from different models, including (a) underlying NAIP image, (b) reference model obtained from LiDAR, (c) CTrees team model, and (d) Tolan model from Meta research team.
Dr. Wagner said, “Thanks to advances in deep learning and publicly available imaging, we can now estimate canopy height – and thus biomass – at the scale of a tree across large regions. The canopy height model unlocks the ability to comprehensively measure biomass and carbon resources both inside and outside forests for the first time, giving us a more complete picture at a state or regional level.”
As a next step, the scientists plan to make the California data available next month on AWS Open Registry, a platform for access to datasets.
The research team is also now developing a canopy height model for the U.S., including Alaska, Hawaii, and Puerto Rico. The model’s success in California's varied landscapes means it will likely also accurately capture canopy height in temperate forests across the country – and the world.
And CTrees is producing a global canopy height map in collaboration with research teams led by Dr. Philippe Ciais, research director at Institut Pierre-Simon Laplace (IPSL), and Dr. Martin Brandt, professor of geography at the University of Copenhagen, building on the researchers’ continental mapping of trees across Europe and Africa. Ciais and Brandt are co-founders of CTrees.
The team aims to replicate the canopy height maps in subsequent years, to show change over time and accurately measure the results of forest re-growth and restoration initiatives. The tree mapping project is part of CTrees’ efforts to produce data products that help governments and organizations to protect and restore forests as a solution to climate change.


